
Without Excellent Reports, Your BPM Software is Uncooked
BPM reporting and analytics are essential to extracting operational value from process automation. Without real-time dashboards, SLA tracking, and process performance reports, organizations lose visibility into workflow health making it impossible to identify bottlenecks or justify continuous improvement investments. The blog explains what effective BPM reporting looks like and which metrics matter most for process owners.
Nearly every BPM product will claim it can deliver reports – but are all reports the same? What’s the difference between good reports and good-enough reports?
Good Reports Turn Good IT Directors into Superstars
Reports and predictive analysis in a business process management solution help businesses improving existing processes, forecast market behavior, identify customer expectations, and increase overall profit margins.
When IT managers break down report data to the C-suite into an easy-to-follow format, management will love it. Imagine the marketing department being able to show data on how long each task takes to complete. Or a manufacturing company getting clear data on how their shipping processes can be improved. Data from reports and analytics can work as a compass to guide businesses how to take appropriate actions and boost productivity.
In essence, great reporting features on a business process management tool means that you can tell better stories about how your processes are actually improving. Without good reporting, you won’t be able to impress business leaders who need to immediately see the value in a BPM solution.
Ready-to-Eat Data
Building reporting into a BPM solution is fairly easy to do, but it is often in raw data that only the most skilled IT managers can manipulate into a digestible format. Just like you wouldn’t serve raw meat and onions to a guest, data also has to be processed in a way that makes sense for those consuming it. Companies that are willing to painfully sift through meaningful data are rewarded with insights, but most organizations can’t afford the time and skill it takes to accomplish this.
When evaluating a business process management system, ask these questions about the reporting:
- What kind of pre-formatted reports are available?
- Do they show all the information you need?
- How customizable are they?
- Do you have access to the raw data?
- How easily can you export data out of the system?
- How easy is it to share data with other business leaders?
Key Data Points for BPM software
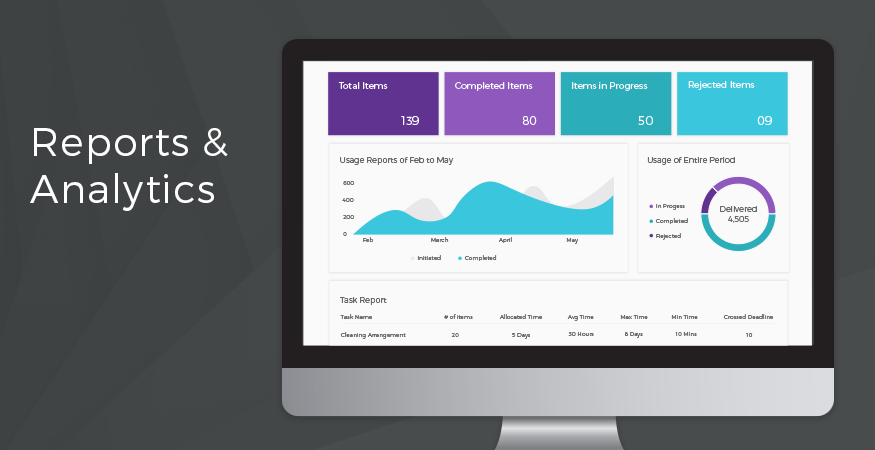
Minimally, your BPM solution should offer you instant reporting in these areas:
- An overview of all uncompleted items
- The min, max, and average time taken to complete a workflow
- The min, max, and average time taken to complete individual tasks
- How often an item gets rejected or rerouted
- How often an item exceeds the task-level deadline or service level agreement (SLA)
- How many items were initiated in a set time period
- How many items were completed in a set time period
Specialized Reporting
Some BPM suites offer the capability to issue ad-hoc reports that can be used to generate specialized, domain-specific reports or graphs. For instance, if a business uses BPM for managing its annual expenditure, it can create a domain that has all the information about the departments receiving funds, reasons for spending, amount spent on each marketing campaign, monthly spending, etc.
It’s ideal for a BPM product to present report data and analytics in an interactive UI, such as pie charts or graphs. When users click on high severity data, they should be able to explore the event in a new dashboard and comprehend the details in depth.
Based on the BPM’s functionality, the reports data can be scheduled to be distributed to individuals or groups in the organization for a one-time purpose or on a routine basis. Reports can also include data from within the BPM suite or data linked to other systems to provide an operational view of the enterprise processes.
The Consumerization of Analytics
Cloud-based application development platforms are democratizing the BPM adoption since they allow even non-technical business users to build end-to-end workflow processes on their own. Traditionally, reports and analytics also were a stronghold of the IT department, especially because they knew the underlying technology behind them.
But more recently, there is trend where software vendors have introduced low-code, point-to-click, simple interfaces targeted at end-users for creating a self-service analytics tool and data visualization methods. This has empowered business users to adopt the consumer route in understanding data and choosing the best software that caters to their needs.
This consumerization, within the context of BPM software, has given more power to process stakeholders without compromising on business operations or processes. Now they can discover data by themselves, share it across other teams, centralize the data insight for collective enterprise knowledge, and make better business decisions.
Reports Make the BPM System
Businesses can achieve a lot by choosing a BPM Software that puts end users in control of how to read into the analytics and use it on their own terms. Don’t overlook the importance of reporting. Without it, you may have selected the best BPM software in the world, but no one will know because you won’t be able to share the story
Frequently asked questions
1. What is BPM reporting?
BPM reporting provides visibility into process performance through dashboards, metrics, and analytics. It tracks KPIs like cycle time, completion rates, and bottlenecks. Kissflow's built-in reporting engine delivers real-time process insights without requiring external BI tools.
2. What KPIs should BPM reports track?
Essential BPM report KPIs include cycle time, process completion rate, SLA compliance, error rate, cost per instance, and user adoption. Kissflow's customizable dashboards let process owners configure reports around the specific metrics that matter to their workflows.
3. How does BPM reporting support continuous improvement?
BPM reports reveal performance trends, highlight recurring bottlenecks, and quantify improvement opportunities. Regular analysis of Kissflow's process dashboards enables teams to make data-driven optimization decisions and measure the impact of changes over time.
4. What is the difference between BPM reporting and business intelligence?
BPM reporting focuses specifically on process execution metrics like workflow throughput and task times. Business intelligence covers broader organizational analytics including revenue and market data. Kissflow provides process-specific reporting that complements enterprise BI platforms.
5. Can BPM reports be automated?
Yes. Platforms like Kissflow support scheduled report delivery, automated alerts for SLA breaches, and real-time dashboard updates. Process owners receive notifications when metrics exceed thresholds, enabling proactive management without manual report generation.
6. What reporting features should you look for in BPM software?
Look for customizable dashboards, real-time updates, drill-down capabilities, scheduled reports, export options, and role-based views. Kissflow provides all these features with an intuitive visual interface that makes process data accessible to technical and non-technical users alike.
Related Topics:
- Top 11 Features Of A Business Process Management (BPM) System for 2026
- BPM Form Drag and Drop Interface | BPM Form Designers - Kissflow
- Mobile BPM Features | Does BPM have a mobile future?
- Why Mobile Support Matters in BPM Software
- Business Process (BPM) Template | How To Automate It By Your Own?
.webp?width=285&height=570&name=BPM%20leader-1%20(2).webp)
Related Articles

4 MINUTES READ
A BPM Tool Without Reports Is Too Little Too Late
4 MINUTES READ
CIOs Prepare for Big Changes According to MWD Report