SPC Data Collection & Capability Software
A process can drift for three shifts before a Cpk calculated at month-end catches it, and the parts it made are already in inventory. Kissflow captures every measurement against control limits as it happens, flags an out-of-control signal in real time, and calculates capability continuously, not once a month.

Trusted by leading manufacturers worldwide


Every measurement plotted against control limits as it happens, not rolled up once a month
A process can drift for three shifts before a Cpk calculated at month-end catches it, and by then the parts it made are already in someone else's inventory. Statistical process control only works as an early warning if the data gets captured and charted close to real time, and most plants still collect SPC data on paper log sheets or into a spreadsheet charted well after the shift that produced it.
By the time a monthly report flags a slipping Cpk, the process has usually drifted back into control on its own, or drifted further, and nobody can say which shift, operator, or input changed. The control limits on the chart are also only as good as the control plan they came from, and a plant running the two as separate documents ends up with a chart nobody can trace to a decision.
Kissflow captures every measurement against the characteristic's control limits as it's taken, plots it on a live chart, flags an out-of-control signal the moment it happens instead of at the next review, and calculates Cpk and Ppk continuously so capability is a live number, not a monthly report. Every characteristic's limits tie back to the control plan that defines them, so the two never drift apart.
SPC charted after the shift is a warning that arrives after the parts already shipped
Data gets collected on paper
Measurements are logged on a paper sheet at the machine, with no live chart showing where the process actually stands.
Control limits live somewhere else
The characteristic's control limits are documented in the control plan but not connected to how the data actually gets charted.
Out-of-control signals get caught late
A run of points outside the control limits doesn't get noticed until someone charts the data days or weeks later.
Capability is a month-end exercise
Cpk and Ppk get calculated in a monthly report, well after a process that drifted has already made parts.
Six modules. Configurable to your operating model.
Every module ships with default forms, approval logic, integrations, and dashboards. Configure each one to your operating model in the visual builder.
Real-time data collection
Captures measurements at the point of collection, on a shop floor device or manual entry, against the linked characteristic.
Live control charting
Plots every measurement against the characteristic's control limits on a live chart as data comes in.
Out-of-control signal detection
Flags a point or run pattern outside control limits the moment it happens, not at the next scheduled review.
Continuous capability calculation
Calculates Cpk and Ppk continuously from the collected measurements, instead of as a periodic monthly report.
Control plan linkage
Ties every characteristic's control limits directly to the control plan that defines them, so the two never drift apart.
Capability history & reporting
Keeps a full history of measurements and capability trends per characteristic, searchable for a customer or audit review.
From request to system of record in four steps
Capture
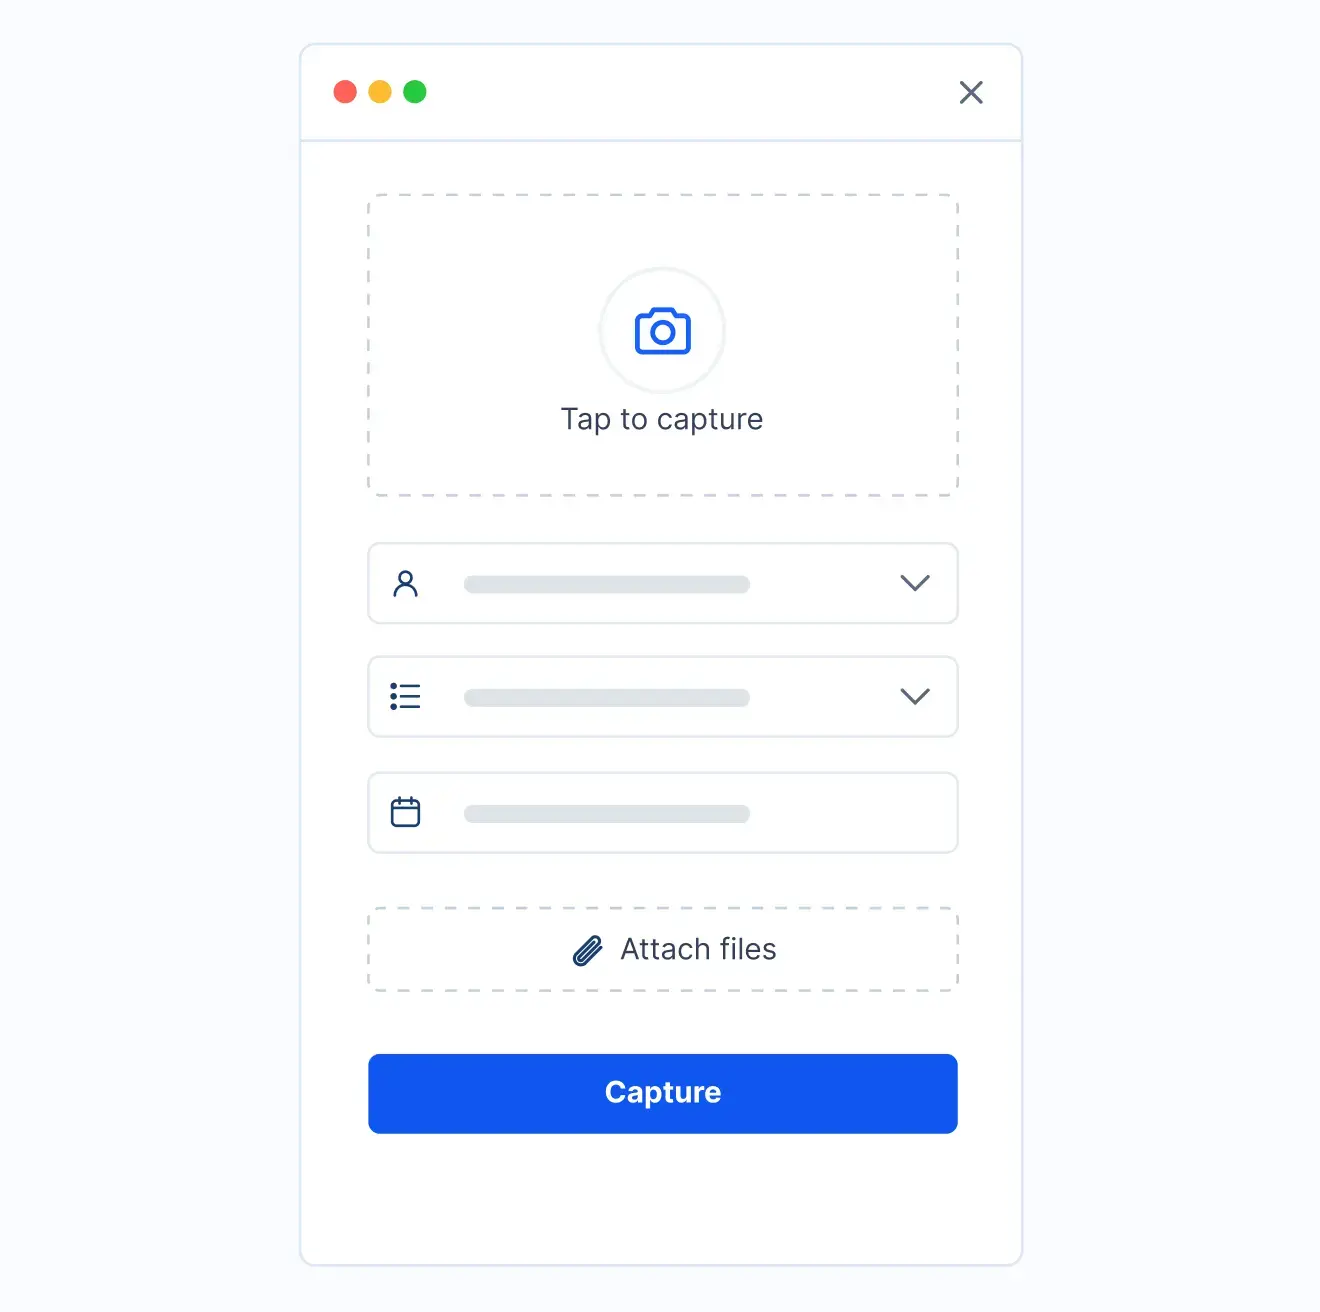
A measurement is captured at the point of collection, linked to the characteristic and its control limits.
Validate
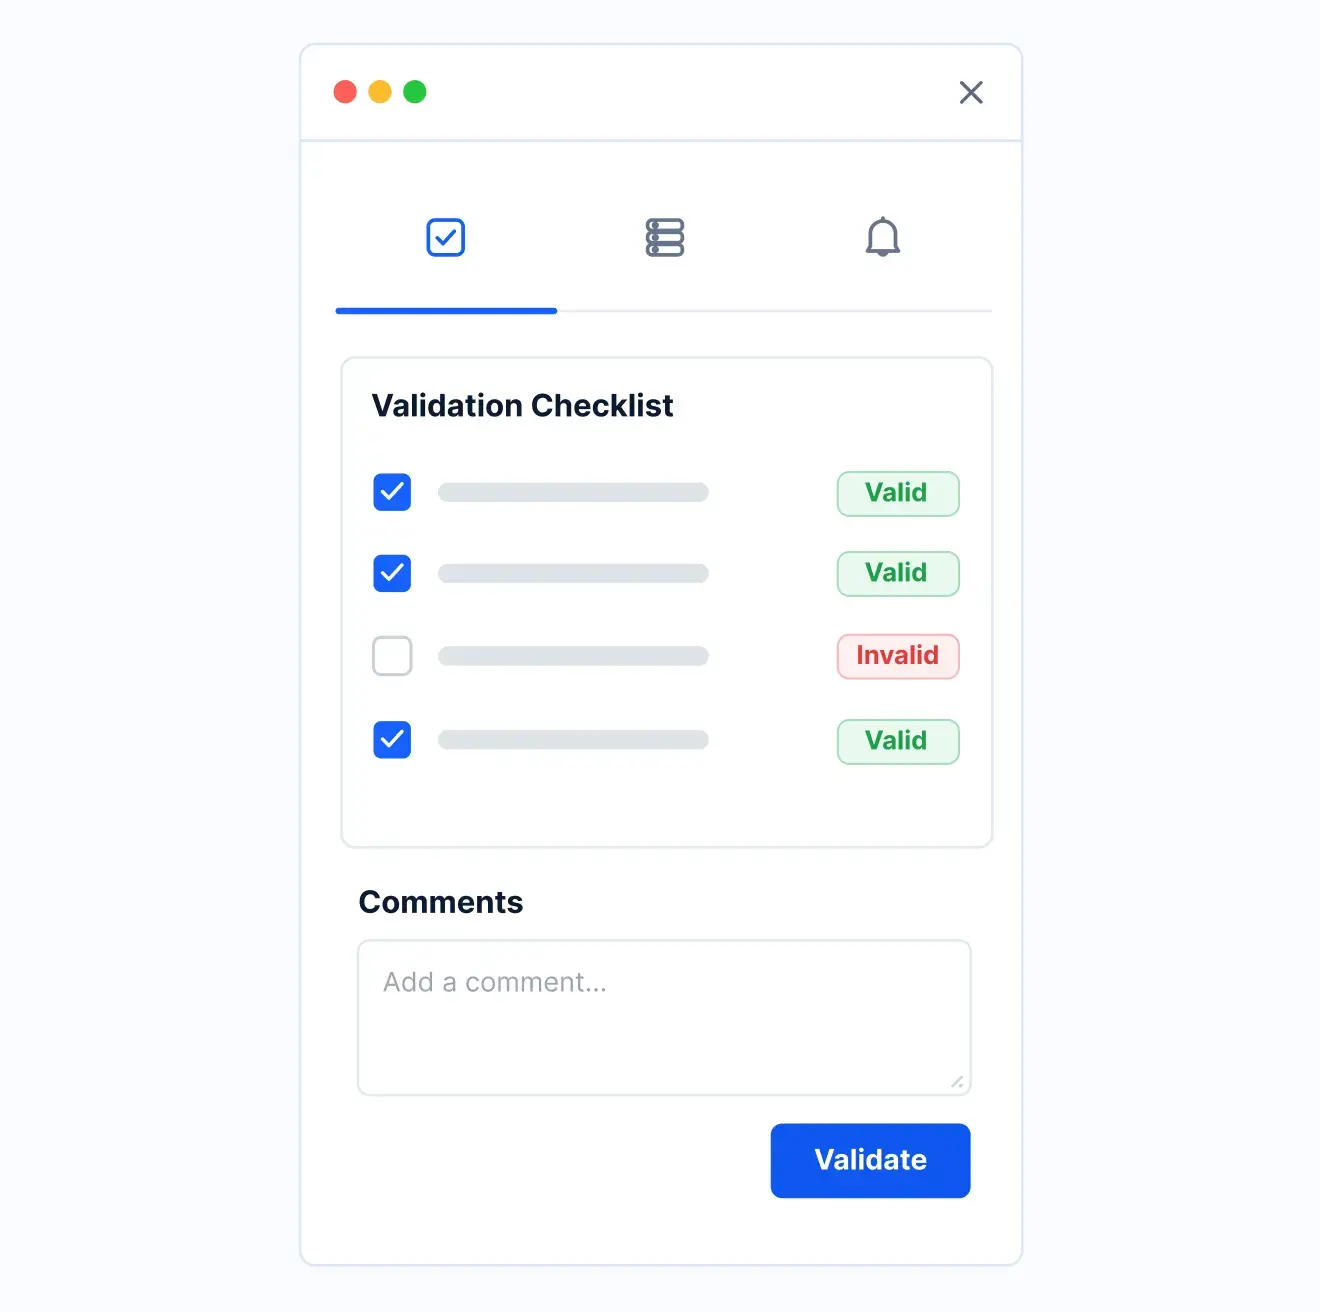
The measurement plots on a live control chart against the characteristic's limits.
Track
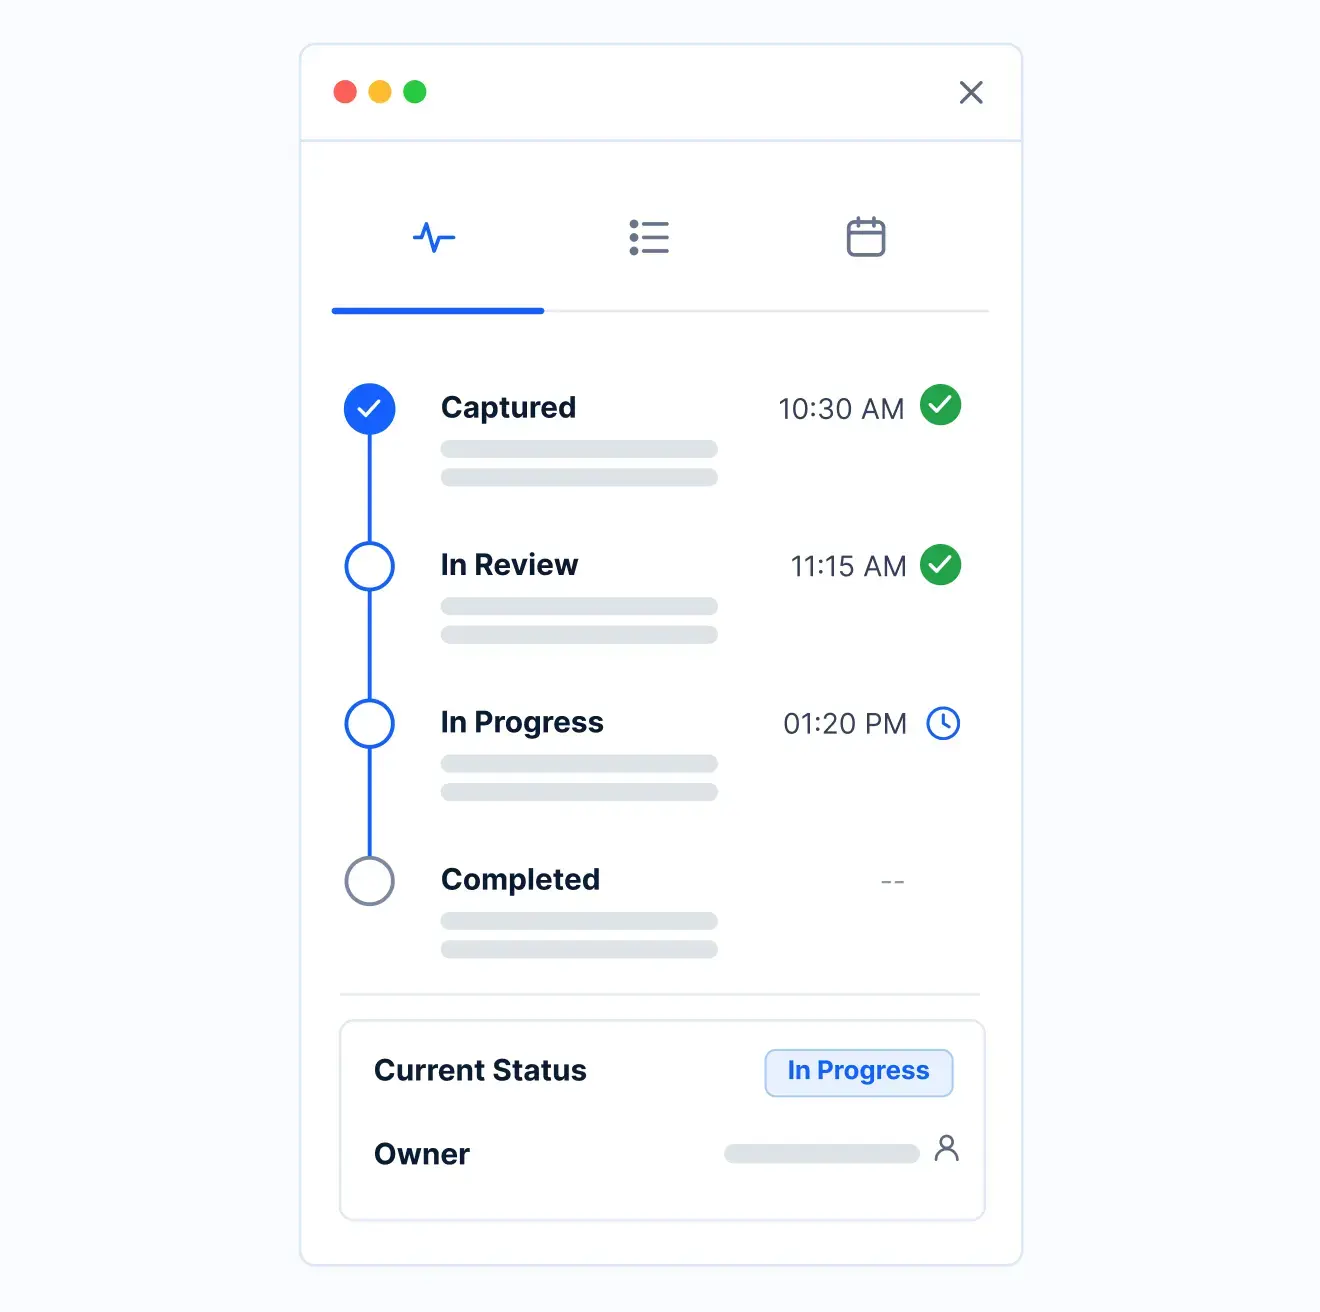
A point or pattern outside the limits is flagged in real time for investigation.
Report
Cpk and Ppk calculate continuously and roll into the capability history and dashboard that stand as the record.
What changes when SPC data collection runs on Kissflow
| Process | Before Kissflow | On Kissflow |
|---|---|---|
| Data collection | Paper log sheets at the machine | Captured digitally at the point of measurement |
| Charting | Assembled well after the shift that produced the data | Plotted live as measurements come in |
| Out-of-control signals | Caught days or weeks later, if at all | Flagged the moment they happen |
| Capability | Calculated once a month | Calculated continuously, as a live number |
| Control limits | Documented separately from how data is charted | Linked directly to the control plan that defines them |
| History | Scattered across log sheets and spreadsheets | Full measurement and capability history per characteristic |
Connects to the shop floor devices and quality systems that already capture your measurements
.svg)



.svg)
.svg)
.svg)
.svg)

.svg)
.svg)
.svg)
.svg)
.svg)

.svg)

.svg)

.svg)
.svg)
.svg)
.svg)
.svg)
.svg)
.svg)
.svg)
.svg)

.svg)
Built to catch drift while it's happening, not at month-end
Control charts that update live
Every measurement plots against control limits as it's captured, not after the shift ends.
Out-of-control signals flagged in real time
A point or pattern outside limits gets flagged the moment it happens, not at the next review.
Capability as a live number
Cpk and Ppk calculate continuously from the data, not once a month in a report.
Directly linked to the control plan
Control limits come from the same control plan record, so the chart and the document never disagree.
Live in weeks, not a re-implementation
Configure data collection points, control limits, and alerting in the visual builder without an SPC platform overhaul.
A full capability history, not a monthly snapshot
Every characteristic's measurement and capability trend is on record, searchable over time.
Related apps
Control Plan Management
Pull control limits directly from the control plan that defines each characteristic's requirements.
Gage & Calibration Management
Confirm the gages feeding SPC data are current on calibration, so the numbers can be trusted.
PFMEA / DFMEA Management
Trace an out-of-control characteristic back to the failure mode risk analysis that flagged it as critical.
We help manufacturers catch process drift while it's happening, not at month-end
.gif)

“If a company cannot enable everybody to use AI, they will never get the true benefit of AI. Platforms like Kissflow allow us to put that capability in the hands of our users in a safe way.”
Vagesh Dave
GVP & CIO at McDermott International, Ltd
See The Full Story

“Advanced automation of all processes is easy to set up. I cannot imagine how to manage workflows without this software.”
Tanay Tiwary
Global Head - Digitalization & Business Improvement
See the Full Story

“Kissflow supports rapid application development by building a working application prototype in the shortest amount of time.”
Maria Theresa Cabigon
CIO, SN Aboitiz Power Group
See The Full Story
See what Kissflow can do for you
Talk to usGot questions? We're here to help.
Get SupportThe Control Plan app documents what should be controlled and how. This app collects the live measurement data against those controls and calculates process capability from it.
Standard rules you configure, a point outside the control limits, or a run pattern like several consecutive points trending in one direction, flagged as soon as it occurs.
It's built to replace paper log sheets and delayed charting with real-time capture and live charts. Manual entry is still supported where automated data capture isn't available.
Continuously, as new measurements come in, rather than on a fixed monthly or weekly schedule, though you can also pull a snapshot for a specific reporting period.
Yes. Quality engineers configure data collection points, control limits, and alert rules in the visual builder, and the AI Builder can generate a working app from a plain-language description.
Through APIs and integration connectors, under single sign-on and role-based access, with every action written to an audit log.
Configuration and AI generation move delivery from weeks to days, without a multi-year platform program or an engineering backlog.
Kissflow is certified to SOC 1, SOC 2, SOC 3, ISO/IEC 27001, HIPAA, GDPR, and CCPA, hosted on Google Cloud with data residency in the US, EU, APAC, and Oceania.