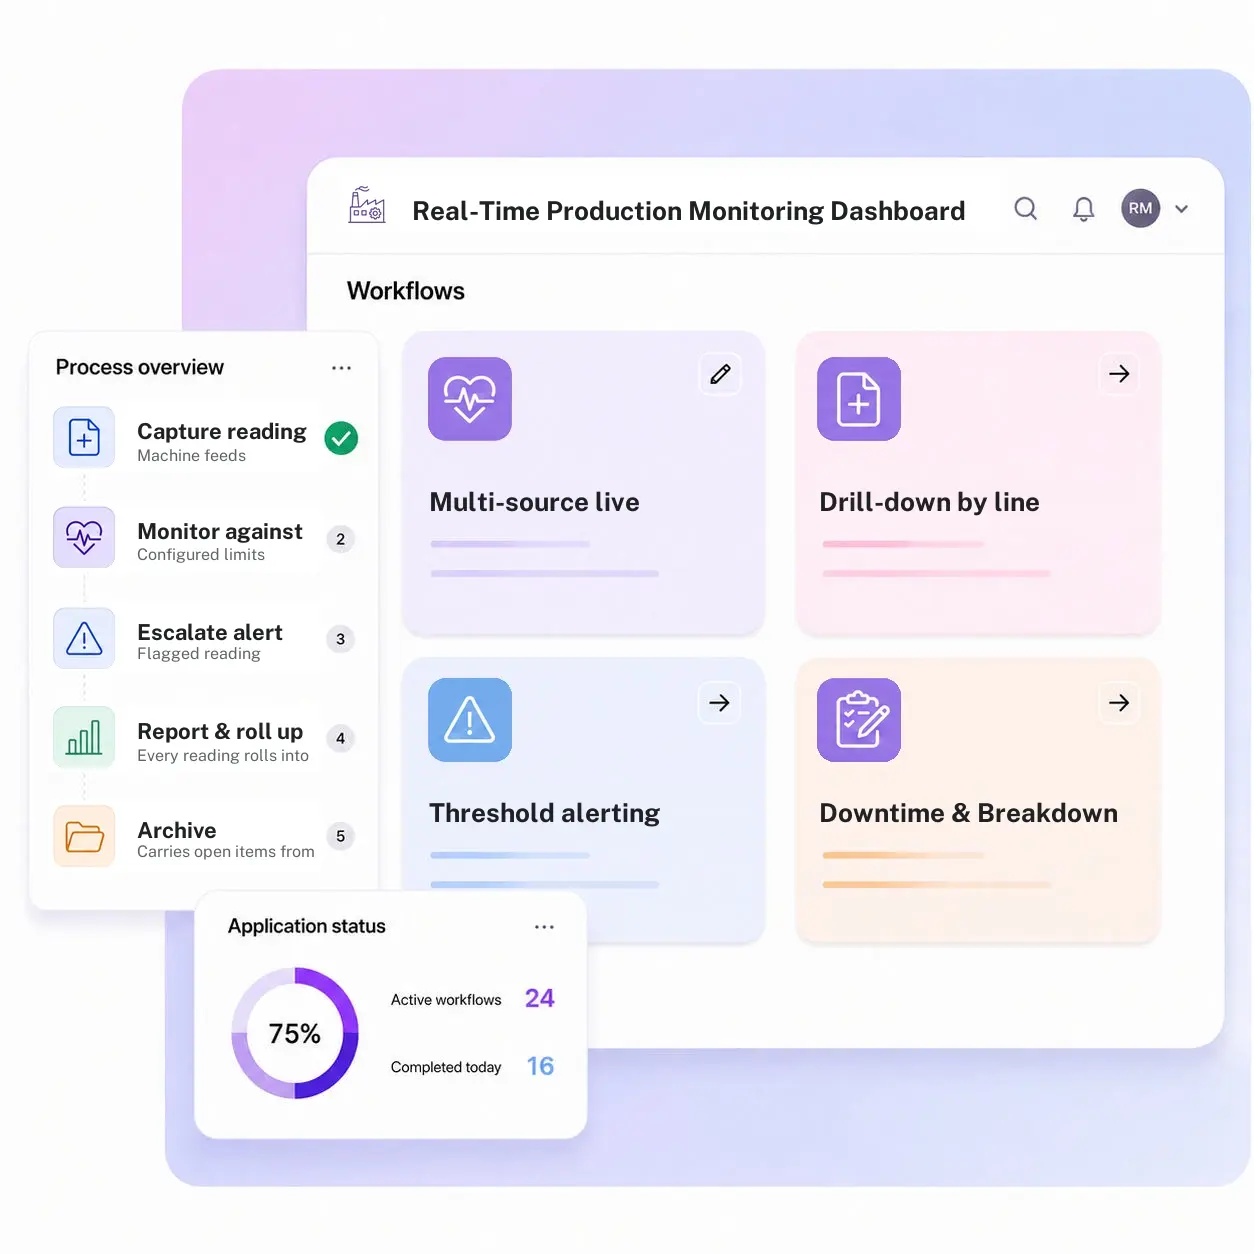
Real-Time Production Monitoring Dashboard for Every Line and Shift
A real-time production dashboard pulls output, downtime, and quality readings from multiple machines and lines into one live view, with drill-down by line, shift, and shift lead, and a threshold alert the instant a reading moves out of range on the floor.
Trusted by energy operators worldwide


One live view across every line, not a spreadsheet rebuilt each shift
Ask three people on the same shift what the line did yesterday and you will likely get three different numbers, pulled from three different screens. Machine data lives on one panel, quality readings on another, and manual counts get reconciled by hand at shift-end, so by the time a number reaches a plant manager it is hours old and quietly already wrong.
Kissflow's real-time dashboard aggregates readings from every connected source, machine feeds, MES data, and manual entry, into one continuously refreshed view, with drill-down from plant to line to shift to the specific reading driving a variance. Configurable threshold rules watch the same live feed and flag a reading the instant it moves out of range, so the alert reaches a shift supervisor before the shift ends rather than at the next morning's meeting.
Because the dashboard is configured rather than custom-coded, a plant manager can add a new line, a new metric, or a new view without filing an engineering request, and every plant can run the same dashboard definition so a corporate operations review compares numbers that mean the same thing at every site.
A production picture that is hours old is a picture of what already happened
Data trapped by source
Machine data, quality readings, and manual counts sit in separate systems that nobody reconciles until shift-end.
No drill-down
A plant-level number hides which line or shift is actually driving the variance.
Alerts arrive late
Without a threshold rule watching the feed, an exceedance is discovered at the next scheduled review, not when it happens.
Every plant builds its own version
Each site assembles its own spreadsheet dashboard, so a corporate operations review compares numbers that were never defined the same way twice.
Three process modules
Every module ships with default views, alert rules, and integrations. Configure each one to your plant in the visual builder.
Multi-source live dashboard
Aggregates output, downtime, and quality readings from connected machines, MES feeds, and manual entry into one continuously refreshed view.
Drill-down by line and shift
Moves from a plant-level number down to the specific line, shift, and machine driving a variance, without a separate report request.
Threshold alerting
Configurable limits trigger an alert the moment a reading crosses the line, sent straight to the shift supervisor on record.
From request to system of record in four steps
Capture
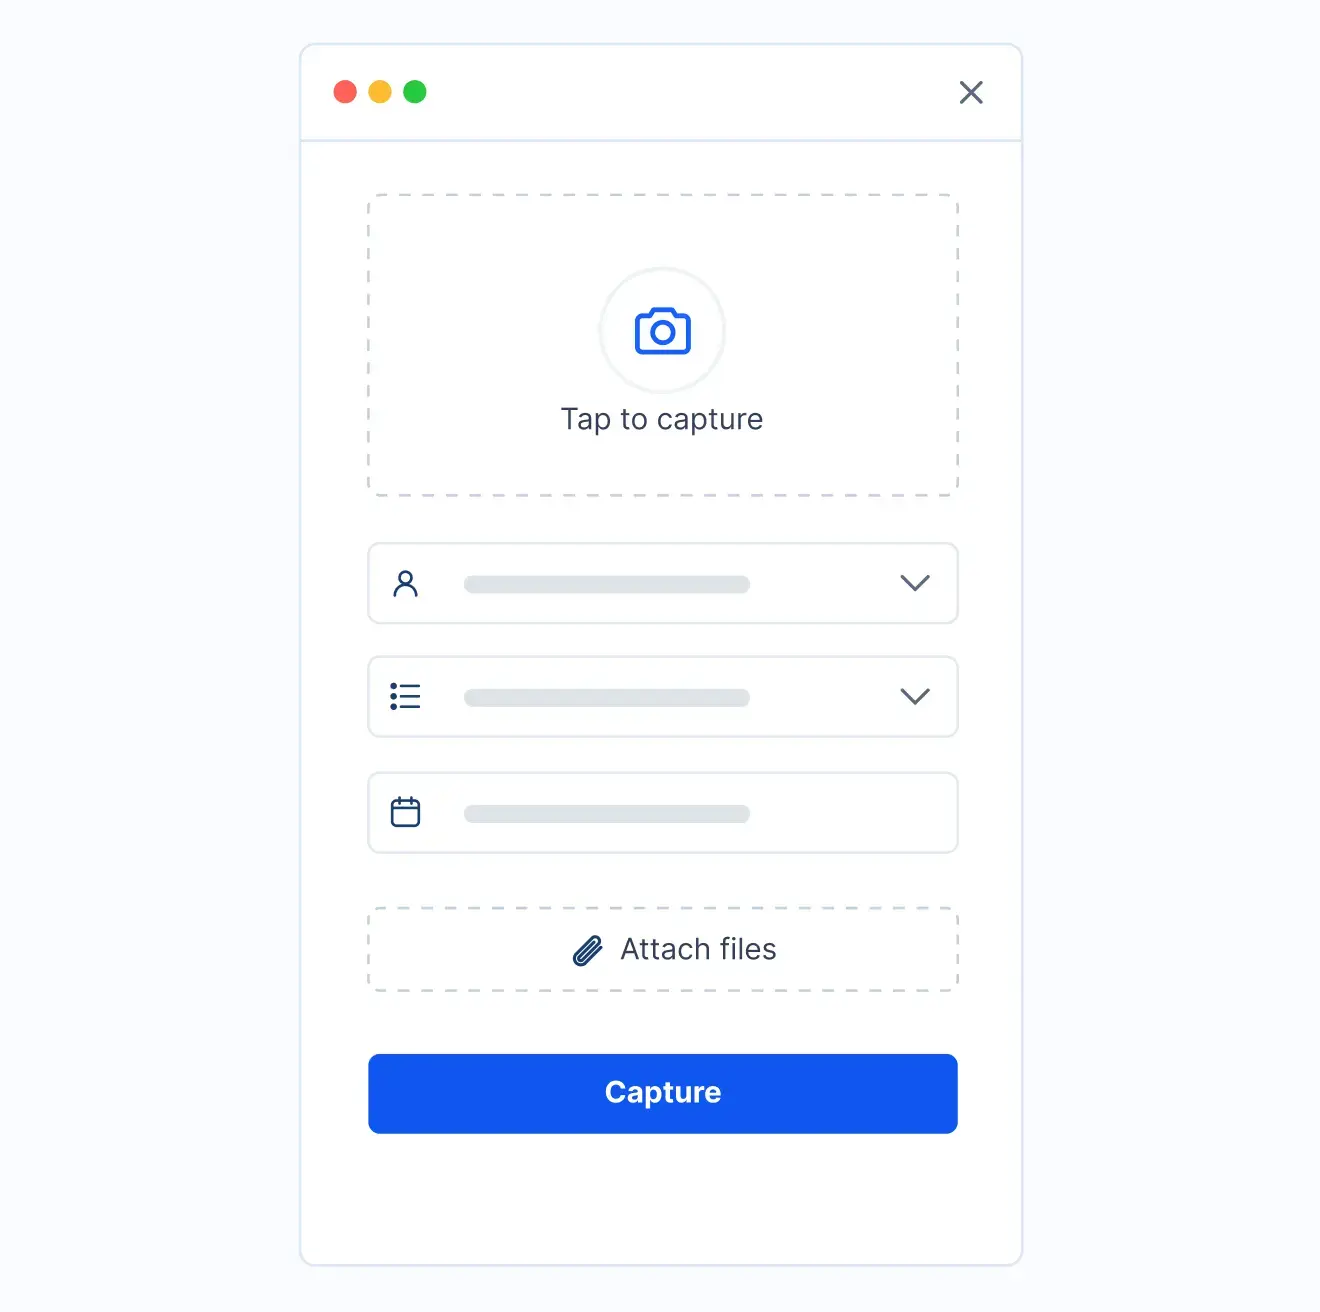
Machine feeds, MES data, and manual entries land in one live record the moment they happen.
Validate
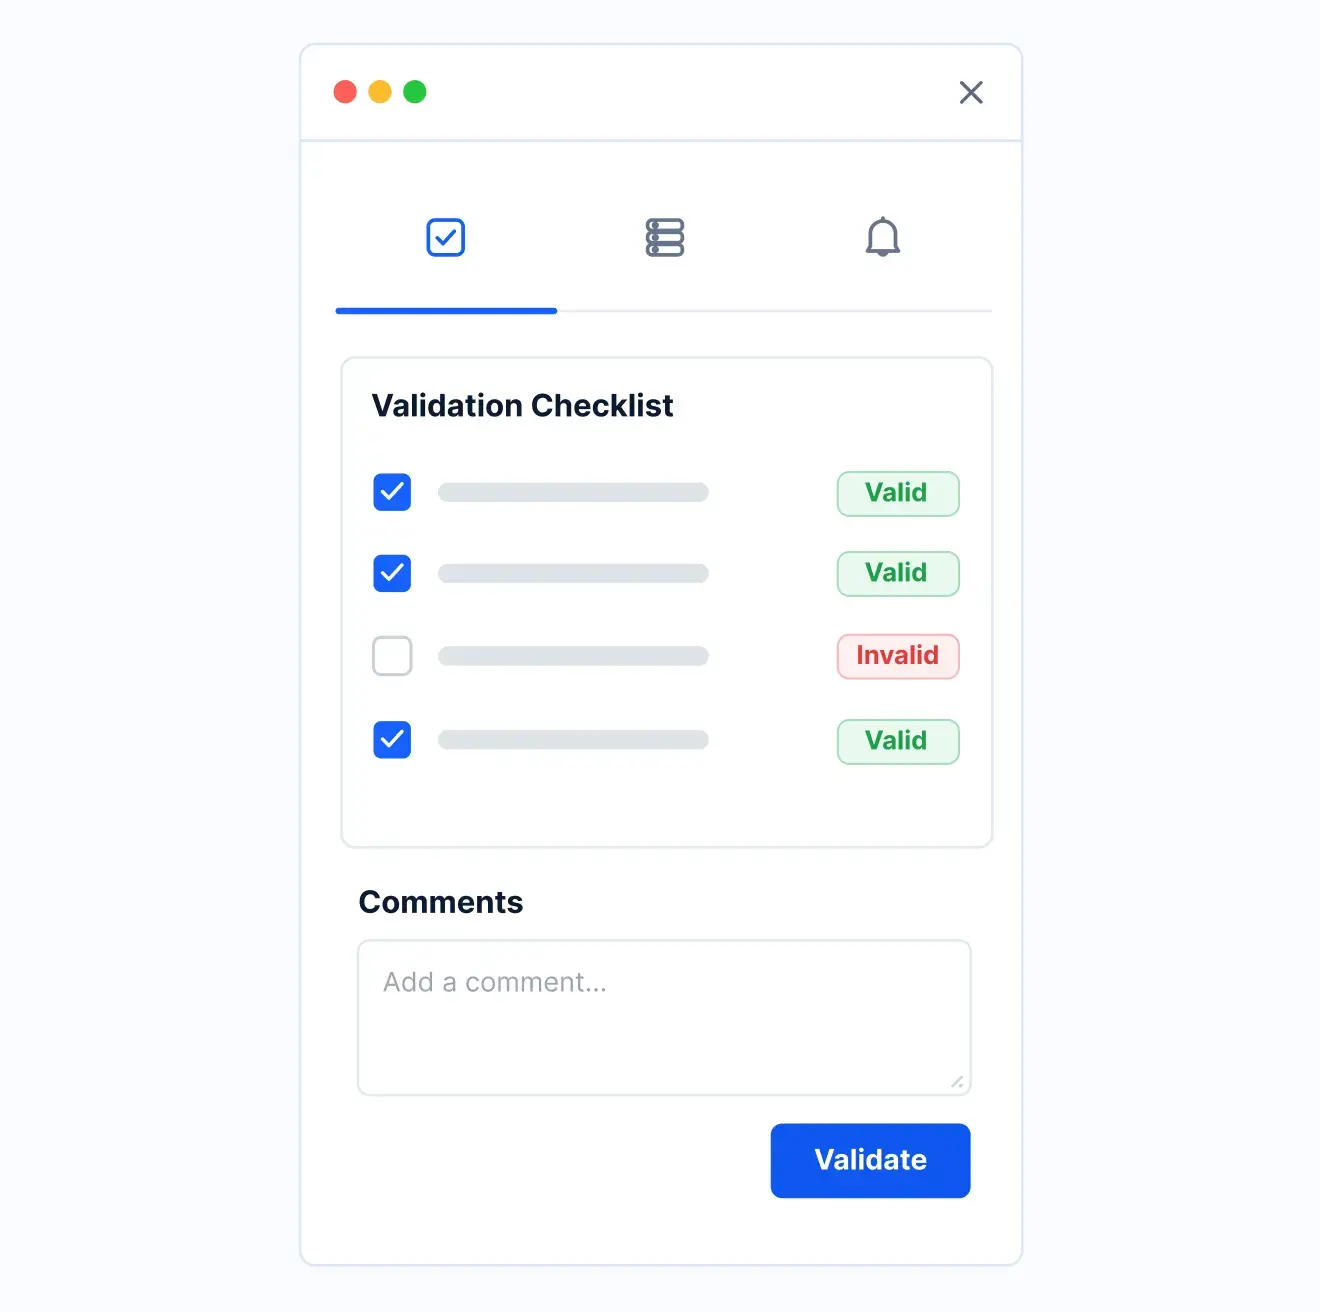
Configured limits continuously watch every incoming reading against its threshold.
Track
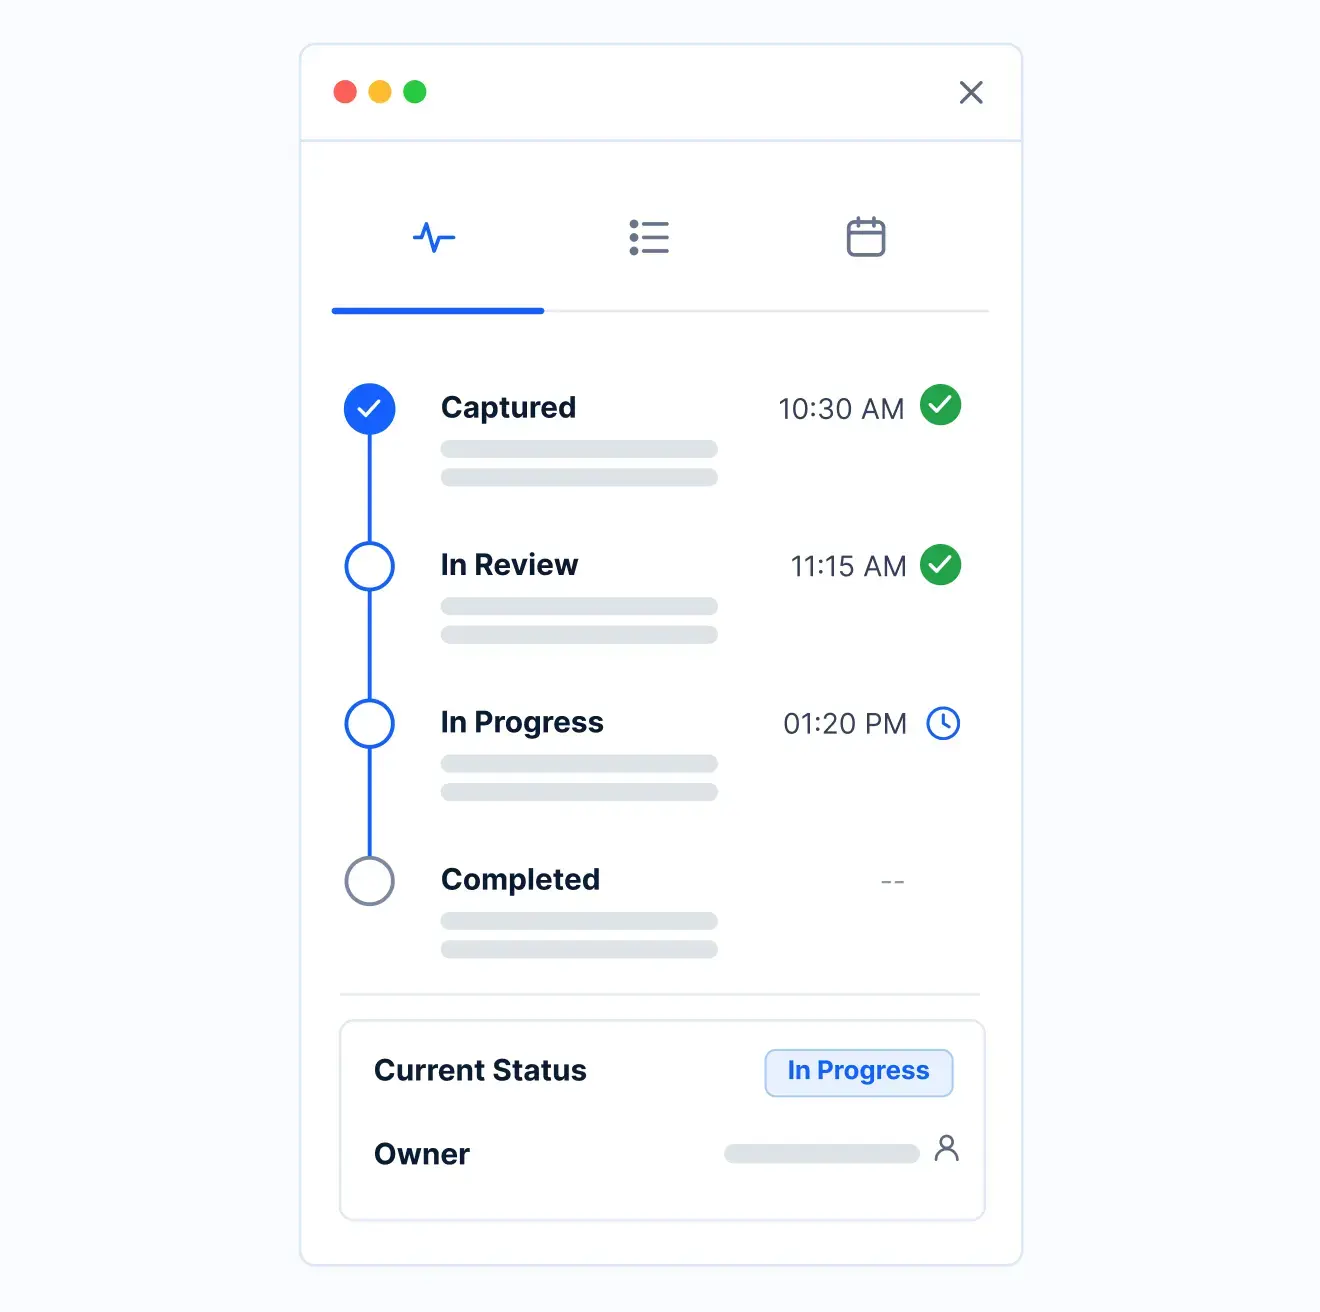
A reading that breaches its limit flags immediately and notifies the shift supervisor, not at the next scheduled review.
Report
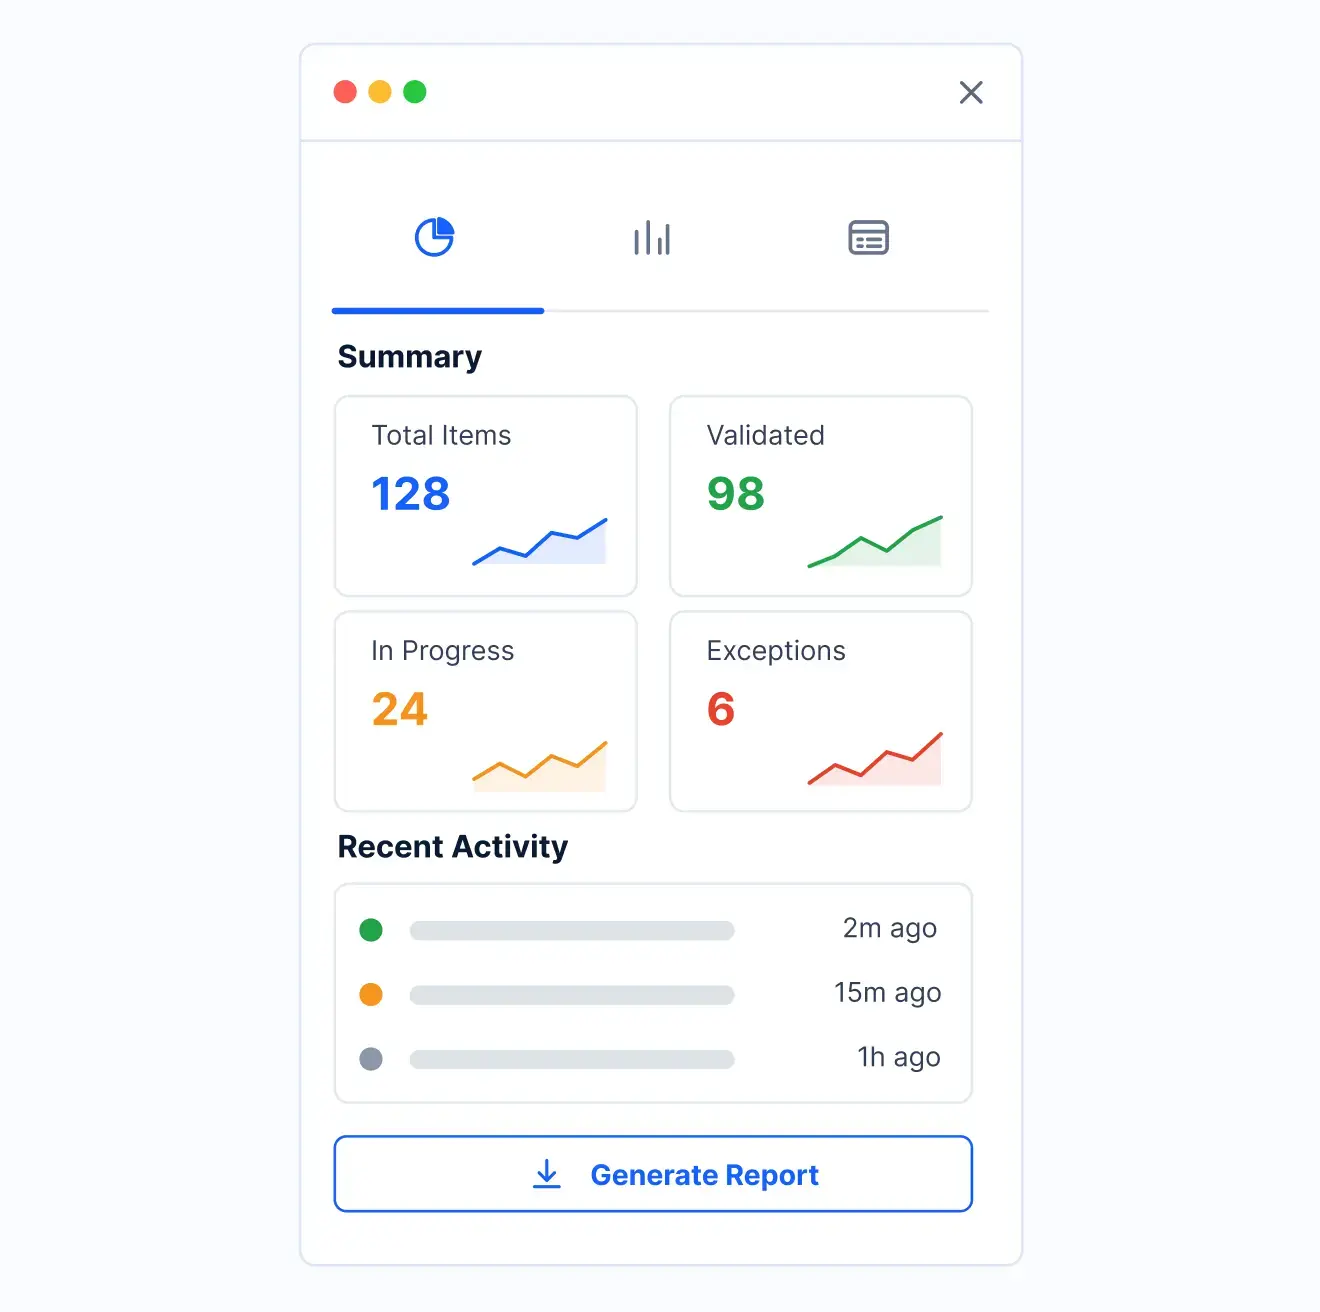
Every reading rolls into a live dashboard that is the system of record, with drill-down from plant to line to shift.
What changes when the production dashboard runs on Kissflow
| Process | Before Kissflow | On Kissflow |
|---|---|---|
| Data sources | Scattered across machine screens and spreadsheets | Aggregated into one continuously refreshed view |
| Drill-down | Requires a separate report request | Available instantly from plant to line to shift |
| Threshold breach | Found at the next scheduled review | Flagged the moment it happens |
| Cross-plant comparison | Each site builds its own spreadsheet | One dashboard definition used across every plant |
| Historical trend | Rebuilt manually for each review | Available as a rolling view without extra work |
| Dashboard changes | Requires an engineering request | Configured by the plant manager in the visual builder |
Connects to the systems your plant already runs on
.svg)



.svg)
.svg)
.svg)
.svg)

.svg)
.svg)
.svg)
.svg)
.svg)

.svg)

.svg)

.svg)
.svg)
.svg)
.svg)
.svg)
.svg)
.svg)
.svg)
.svg)

.svg)
Built for how a plant actually watches its lines
A live view, not a static report
The dashboard reflects what is happening on the floor right now, not what happened at last shift's export.
Configured, not custom-built
Plant managers add lines, metrics, and views in the visual builder, without an engineering ticket.
Drill-down without a report request
Move from plant to line to shift in the same view instead of asking for a new report each time.
Alerts built on the same data
Threshold rules run against the live feed, so the alert and the dashboard never disagree.
One definition across every plant
Every site sees the same metrics defined the same way, so a corporate review compares like with like.
Live in weeks
Configuration and AI-assisted setup bring a new plant onto the dashboard in weeks, not a multi-month rollout.
Related apps
Production Monitoring and Optimization
Adds the exception and corrective action workflow that responds to what the dashboard shows.
Shift Handover and Pending Action Tracking
Carries open items from the dashboard into a structured shift handover record.
Downtime and Breakdown Reporting Software
Breakdown reporting that feeds MTTR and OEE automatically
We help manufacturing operations teams see the floor as it actually runs
.gif)

“If a company cannot enable everybody to use AI, they will never get the true benefit of AI. Platforms like Kissflow allow us to put that capability in the hands of our users in a safe way.”
Vagesh Dave
GVP & CIO at McDermott International, Ltd
See The Full Story

“Advanced automation of all processes is easy to set up. I cannot imagine how to manage workflows without this software.”
Tanay Tiwary
Global Head - Digitalization & Business Improvement
See the Full Story

“Kissflow supports rapid application development by building a working application prototype in the shortest amount of time.”
Maria Theresa Cabigon
CIO, SN Aboitiz Power Group
See The Full Story
See what Kissflow can do for you
Talk to usGot questions? We're here to help.
Get SupportIt is a live view that aggregates output, downtime, and quality readings from multiple machines and lines into one continuously refreshed dashboard, with drill-down by line and shift and a threshold alert on any reading out of range.
An MES screen typically covers one system's data. This dashboard aggregates readings across MES, machine feeds, and manual entry into one view, and adds configurable threshold alerting on top.
This app is the live visibility layer: readings, drill-down, and alerts. Production Monitoring and Optimization adds the workflow layer on top, turning a threshold breach into a tracked exception with root cause and corrective action.
Yes. Dashboards, metrics, and views are configured in the visual builder, so a plant manager can add a line or a metric without an engineering request.
Yes. One dashboard definition can run across every site, so a corporate operations review compares numbers defined the same way everywhere.
Threshold rules run against the live feed, so an alert reaches the responsible supervisor as soon as a reading crosses the configured limit.
No. The dashboard aggregates and visualizes data from those systems. They remain the source of the underlying machine data.
Yes. The same records that power the live view roll up into a historical trend without a separate export.