Production Monitoring Optimization Software for the Shop Floor
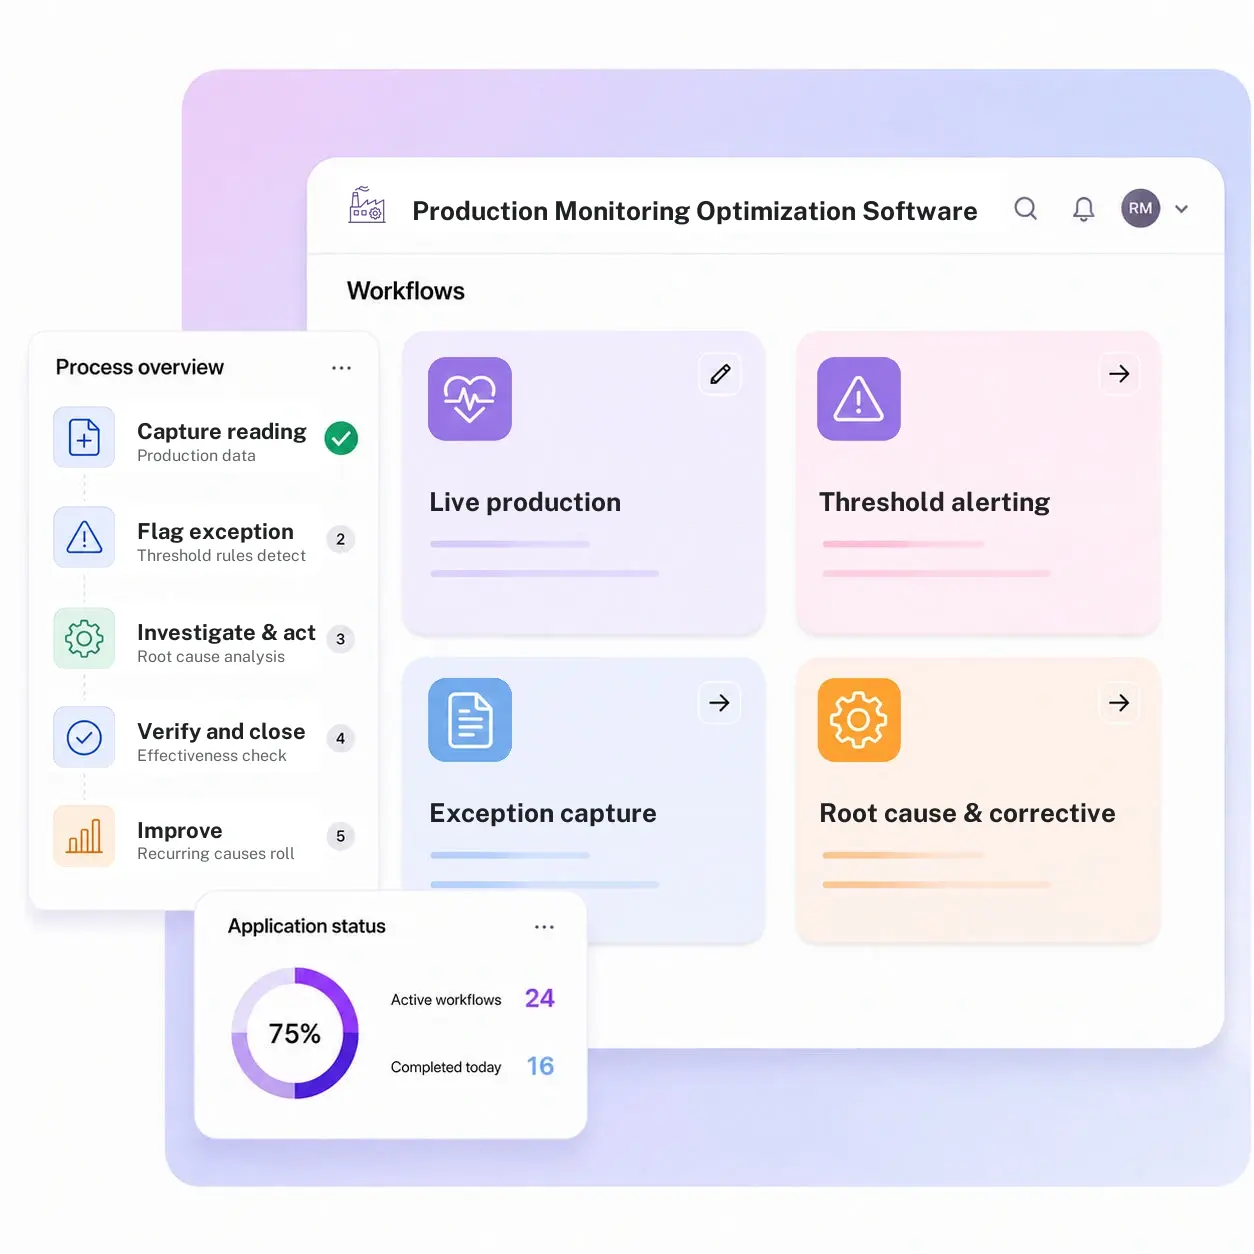
A production monitoring app captures line output, downtime, and quality readings against plan, flags threshold breaches the instant they occur, and routes each one to the right owner. Kissflow layers this on top of your MES and ERP, so a breach becomes a tracked exception, not a missed shift-end conversation.
Trusted by energy operators worldwide


One app for production data, exceptions, and the record of what happened
By the time a threshold breach shows up in the shift-end conversation, the shift that mattered is already over. On most shop floors, production monitoring runs across a machine data screen, a group chat, and a spreadsheet someone updates when they have a minute. A line drifts past a scrap limit, someone notices on a dashboard, the fix gets discussed out loud, and the reason for the variance is never written down anywhere an audit can find it.
Kissflow turns production monitoring into a governed app instead of a screen. Output, downtime, scrap, and quality readings are captured against plan by line and shift, threshold rules flag a breach the moment it happens, and every flagged event becomes a structured exception with a severity, an owner, and a due date. Root cause and corrective action are tracked stages on the same record, and open exceptions carry into the next shift's handover automatically.
Plant managers configure thresholds, escalation paths, and reporting views themselves in the visual builder, without filing a ticket with IT. The MES or SCADA layer stays the system of record for machine data; Kissflow runs the exception and corrective action workflow around it.
A monitoring dashboard without a workflow underneath just tells you something is wrong
Breaches get seen, not resolved
A dashboard flags an exceedance, but nothing routes it to an owner, so it sits until someone notices at shift-end review.
No record of the fix
Corrective action happens over a phone call or a message, and the reason for a variance is never written down anywhere an audit can find it.
Shift handover loses context
The incoming shift inherits an open issue with no history of what was already tried and why it did not work.
Optimization stays anecdotal
Without a structured record of exceptions and root causes, recurring line losses get treated as one-off events instead of a pattern.
Six process modules
Every module ships with default forms, routing logic, and dashboards. Configure each one to your operating model in the visual builder.
Live production dashboard
Rolls up output, downtime, scrap, and quality readings by line and shift against the production plan as data arrives from the floor.
Threshold alerting
Configurable limits on output, downtime, and quality readings trigger an alert the moment a reading crosses the line, not at next review.
Exception capture and routing
Every flagged breach becomes a structured record with severity, line, and shift, routed to the responsible supervisor or engineer.
Root cause and corrective action
A structured investigation form links each exception to a confirmed cause and a corrective action, owned and due-dated to close.
Shift handover log
Open exceptions carry forward automatically into the next shift's handover record, so nothing gets lost at the changeover.
Trend and optimization reporting
Recurring causes roll up across lines and shifts into a trend view that turns scattered exceptions into a prioritized fix list.
From request to system of record in four steps
Report
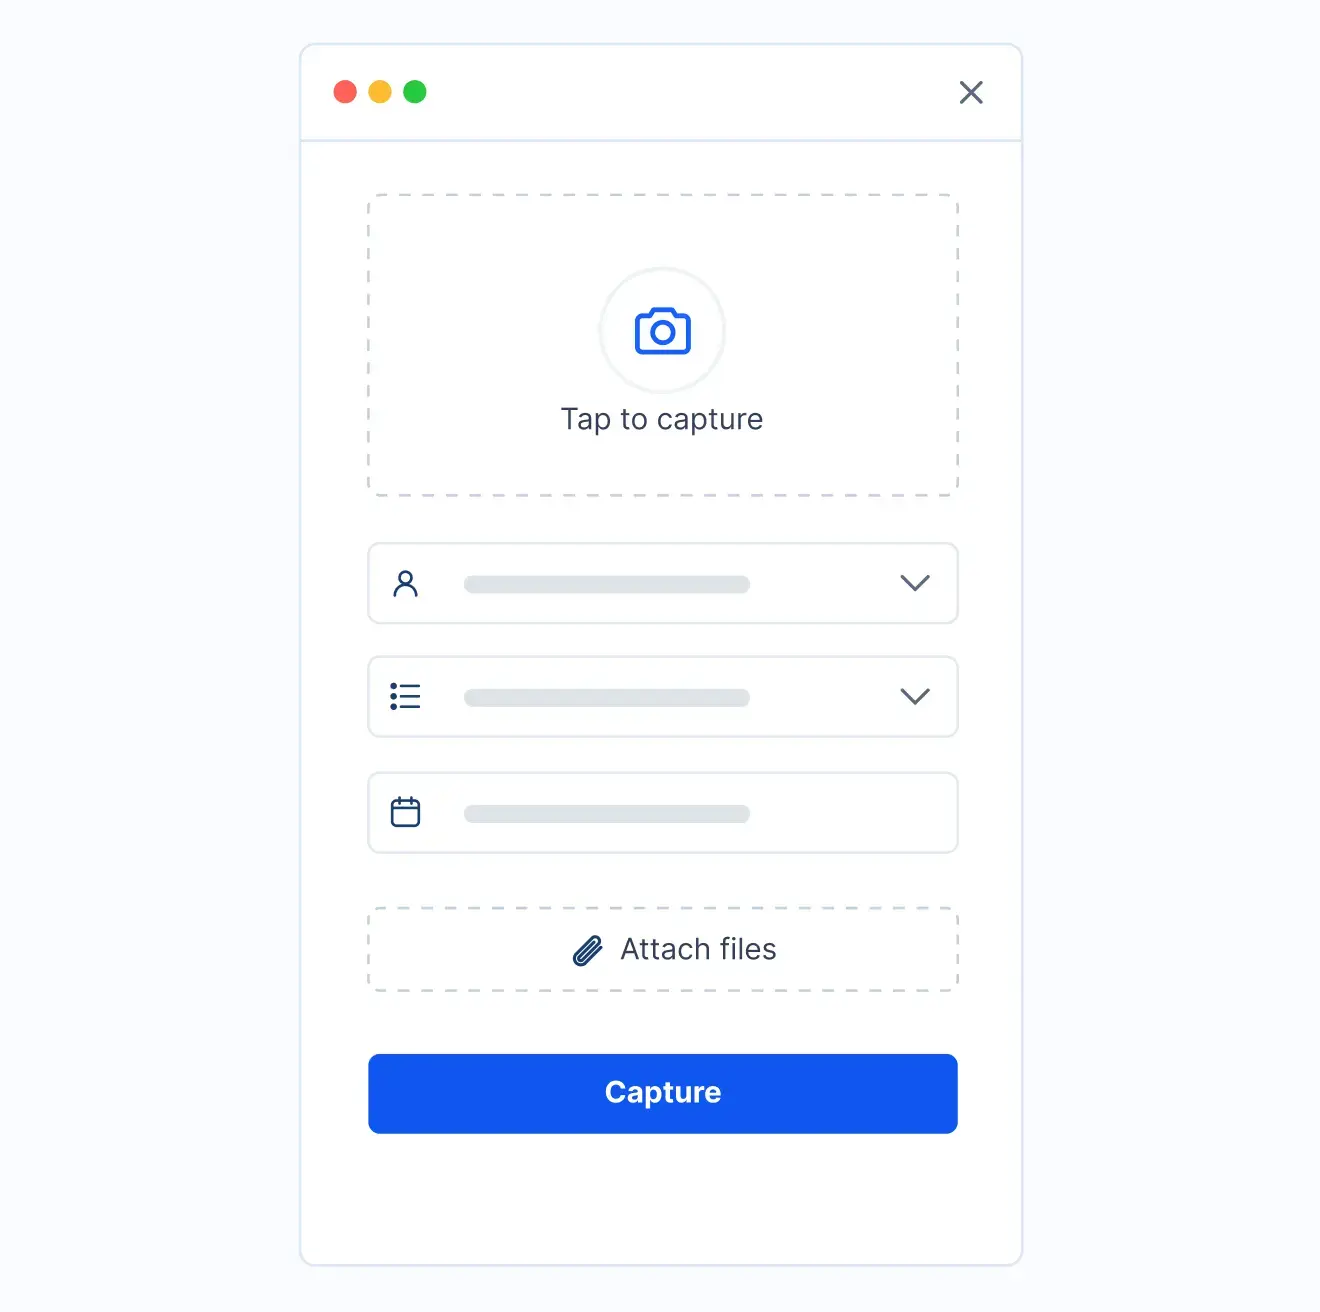
Production data streams in or is logged by line and shift and checked against the plan in real time, and a threshold breach automatically opens a structured exception record with a severity.
Assess
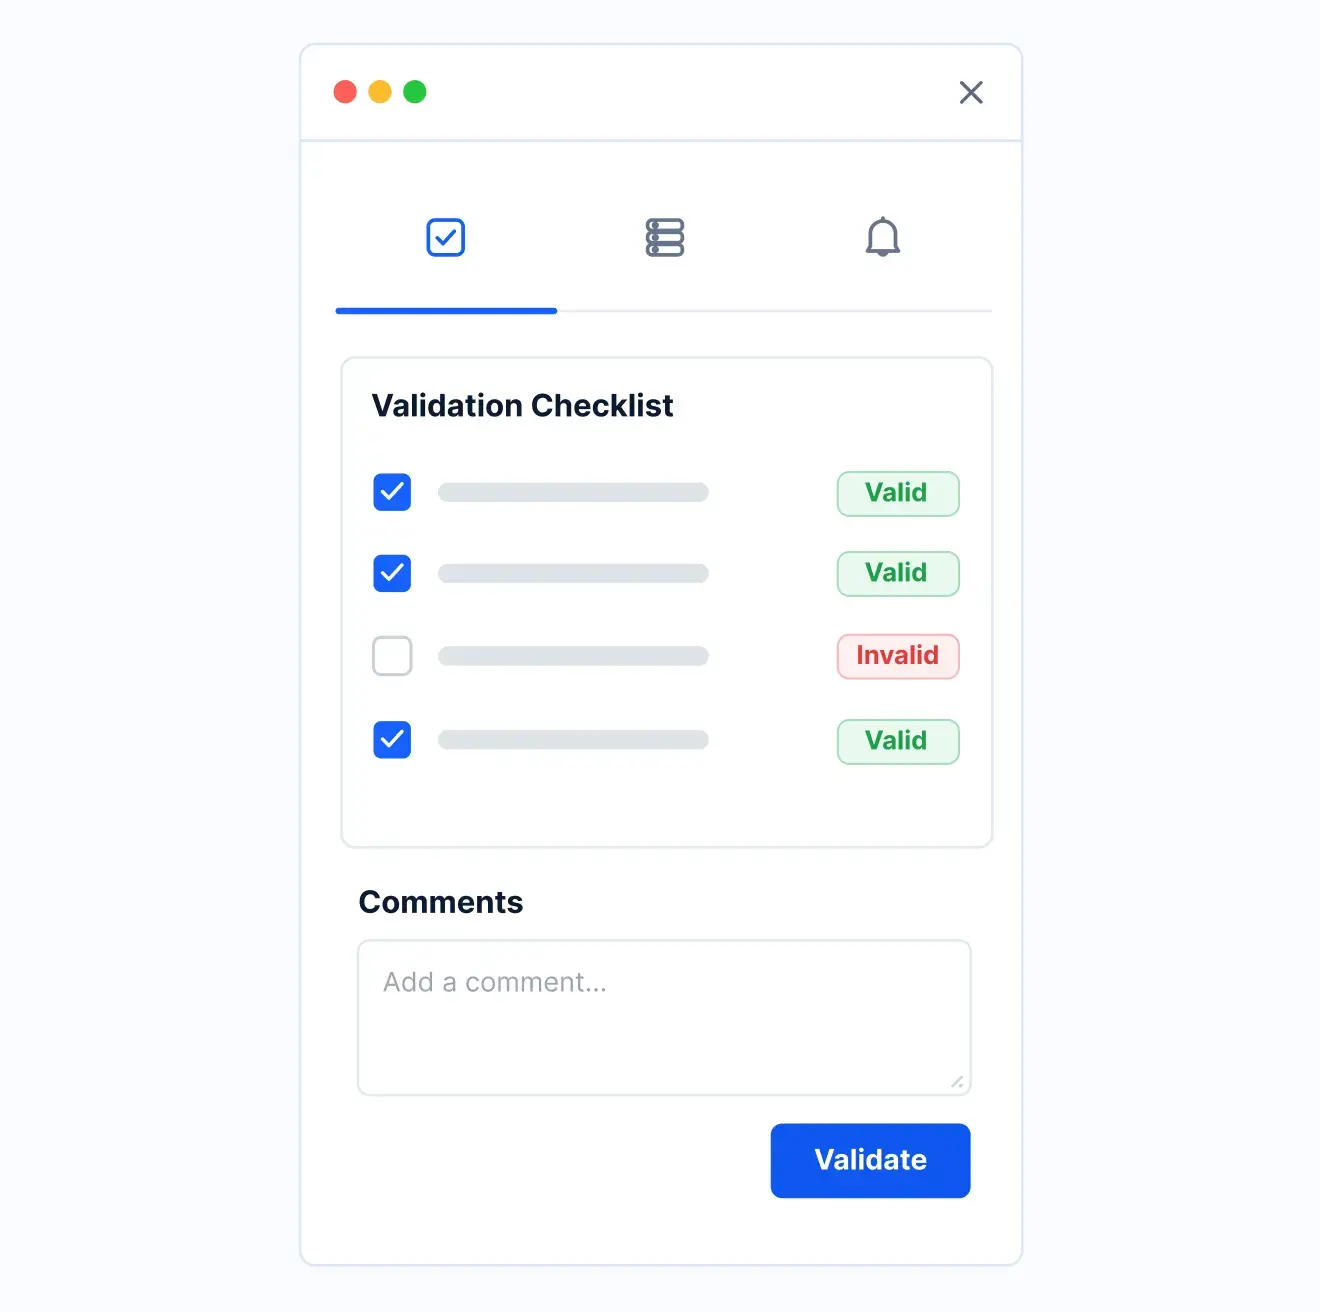
Root cause analysis works the exception to determine what drove the breach.
Resolve
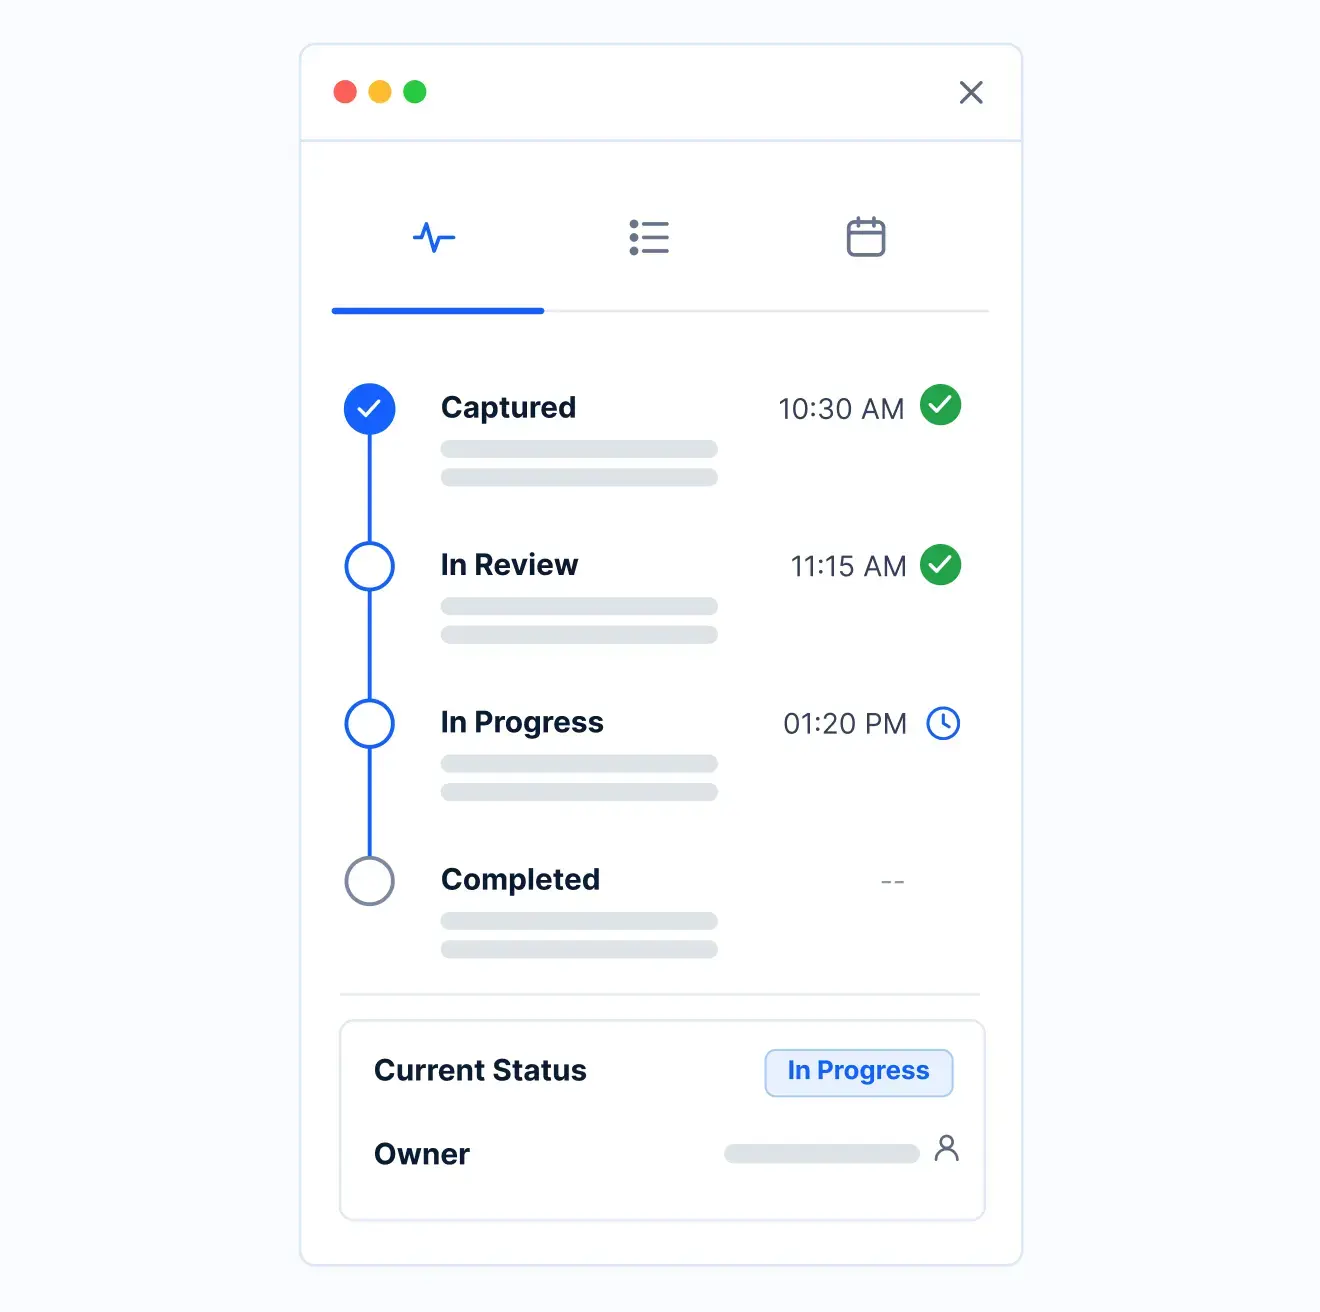
A corrective action is assigned to an owner with a firm due date, and an effectiveness check confirms the fix held.
Record
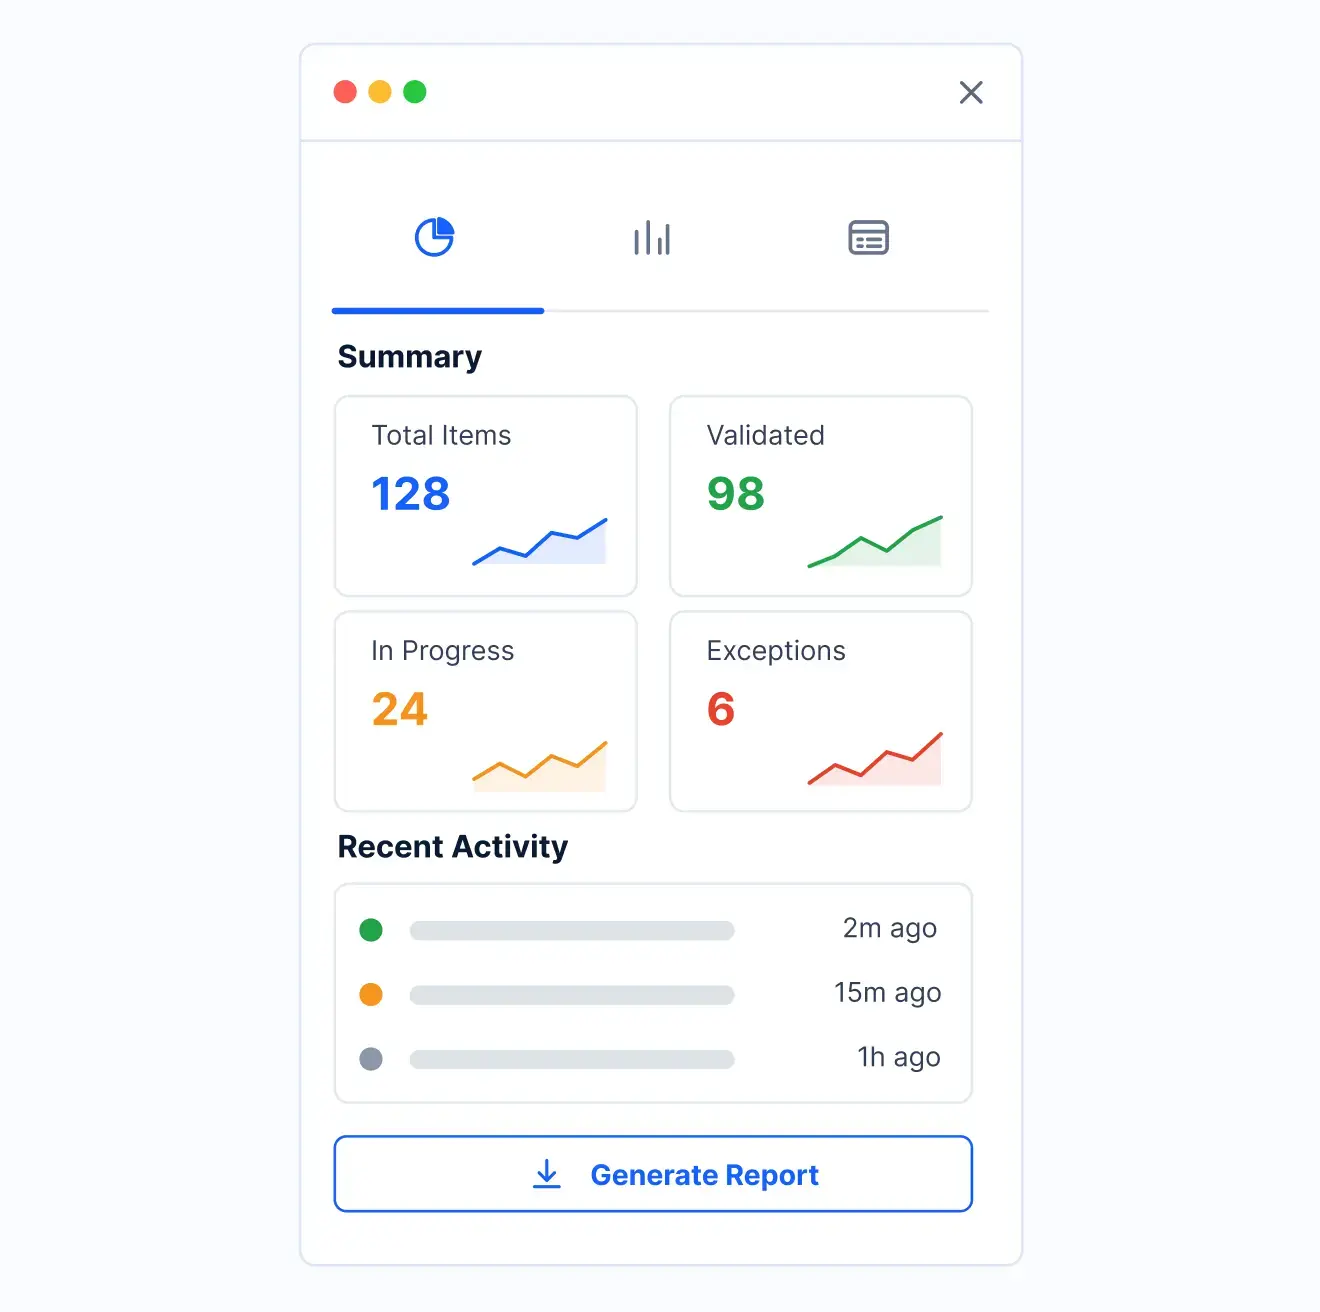
The exception closes only once the fix is verified, and the closed record feeds the trend report layered over your MES and ERP.
What changes when production monitoring runs on Kissflow
| Process | Before Kissflow | On Kissflow |
|---|---|---|
| Threshold breach | Seen on a dashboard, discussed informally | Opens a tracked exception with an owner automatically |
| Root cause | Investigated ad hoc, rarely written down | Captured in a structured form linked to the exception record |
| Corrective action | Agreed over a phone call or chat message | Assigned with a due date and tracked to closure |
| Shift handover | Open issues explained verbally at changeover | Carries forward automatically with full history |
| Recurrence | Treated as a one-off each time | Rolled into a trend view that flags repeat causes |
| Audit trail | Reconstructed from memory after the fact | Generated as the exception is logged and closed |
Connects to the systems your plant already runs on
.svg)



.svg)
.svg)
.svg)
.svg)

.svg)
.svg)
.svg)
.svg)
.svg)

.svg)

.svg)

.svg)
.svg)
.svg)
.svg)
.svg)
.svg)
.svg)
.svg)
.svg)

.svg)
Built for how production exceptions actually happen
An action layer, not another dashboard
Your MES or SCADA shows what the machines are doing. Kissflow runs the exception and corrective action workflow that responds to it.
Live in weeks, not a multi-year program
Configure thresholds and routing in the visual builder, or describe the use case and let the AI Builder generate a starting app. Delivery moves from weeks to days.
Governed from day one
Role-based access and a full audit log are built into every exception, so plant, quality, and operations leadership see the same record.
Built for recurring-cause analysis
Exceptions roll up by line, shift, and cause, so a pattern shows up before it becomes a bigger loss.
Audit-ready by default
Every threshold breach, root cause, and corrective action is timestamped and stored, ready for an operations or quality review.
Built for cross-shift work
Production, quality, and maintenance see the same exception record instead of three different versions of what happened.
Related apps
Real-Time Production Monitoring Dashboard
A live, multi-source dashboard for output, downtime, and quality readings across the plant.
Downtime and Breakdown Reporting Software
Breakdown reporting that feeds MTTR and OEE automatically
Production Deviation Logging and Escalation
Captures process and material deviations on the floor and escalates open ones automatically.
We help manufacturing operations teams run a tighter shop floor
.gif)
“If a company cannot enable everybody to use AI, they will never get the true benefit of AI. Platforms like Kissflow allow us to put that capability in the hands of our users in a safe way.”
Vagesh Dave
GVP & CIO at McDermott International, Ltd
See The Full Story
“Advanced automation of all processes is easy to set up. I cannot imagine how to manage workflows without this software.”
Tanay Tiwary
Global Head - Digitalization & Business Improvement
See the Full Story
“Kissflow supports rapid application development by building a working application prototype in the shortest amount of time.”
Maria Theresa Cabigon
CIO, SN Aboitiz Power Group
See The Full Story
See what Kissflow can do for you
Talk to usGot questions? We're here to help.
Get SupportIt is a governed application that captures production data against plan, flags threshold breaches automatically, and tracks each one through root cause and corrective action to closure, instead of leaving monitoring as a dashboard with no workflow behind it.
An MES or SCADA dashboard shows current machine state. Kissflow runs the exception, escalation, and corrective action workflow that responds to what the dashboard shows, and keeps the record of what was done.
The dashboard app is a pure visibility tool that aggregates live readings from multiple sources. This app adds the workflow layer on top: threshold alerts open tracked exceptions, root cause analysis, corrective action, and shift handover.
Yes. Production planners and plant managers set thresholds, routing rules, and escalation paths in the visual builder, without an engineering ticket.
No. The MES and ERP stay the systems of record for machine and transaction data. Kissflow runs the monitoring workflow, exception handling, and reporting layer around them.
Configuration and AI-assisted app generation bring delivery down from months to weeks, with no dedicated engineering backlog.
Yes. Thresholds and workflows can be configured per line or per plant, and the trend reporting rolls up across all of them into one view.
Every reading, exception, and corrective action is logged with role-based access and a full audit trail, so the record is ready for an operations or quality review at any time.