Cross-Plant Operational Exception Dashboard & Resolution
Cross-Plant Operational Exception Dashboard & Resolution ingests data from every site on one schedule, calculates the same metrics consistently, and alerts the moment a threshold is crossed. Kissflow tracks each exception to resolution across the network.

Trusted by leading manufacturers worldwide


One view of operational exceptions across every plant in the network
What a plant manager at site four cannot see matters more than what they can. The same exception has been happening at sites two and seven for three weeks, because each plant's data sits in its own local system and nobody at group level is looking across all of them at once. By the time a corporate review catches the pattern, it has run long enough to erase the margin on three plants' output, and the fix site two figured out never made it to site seven.
Kissflow runs cross-plant exception monitoring as a single dashboard fed from every site instead of a monthly roll-up deck. Operational data is ingested from each plant on a consistent schedule, and the same metrics are calculated the same way across every site, so a comparison is actually a comparison. Dashboards give both the group-level view and the drill-down into a single plant, line, or shift, and thresholds trigger an alert the moment a metric crosses tolerance rather than waiting for the next scheduled review. Every alert is tracked to resolution, so an exception raised at one site stays visible, and closeable, from the same view a corporate operations team already uses to watch the network.
Exceptions you can't see across plants are patterns you can't act on
Every plant tracks exceptions its own way
Without a shared dataset, one plant's exception rate isn't comparable to another's, even when they're measuring the same thing.
Network-level reporting is a manual roll-up
Someone pulls numbers from every plant into a deck by hand, on whatever cadence they can manage, days behind what's actually happening.
A pattern across plants goes unnoticed
The same exception type spiking at three plants at once looks like three unrelated problems instead of one shared cause.
Surfacing an exception isn't the same as resolving it
A dashboard that only shows the number, with no path to a documented resolution, leaves every exception exactly where it was found.
Six modules. Configurable to your network's metrics.
Every module ships with default data models, dashboards, and alerting. Configure each one to your operating model in the visual builder.
Multi-plant data ingestion
Operational data is ingested from every plant on a consistent schedule, so no single site's numbers lag behind the rest.
Metric calculation
The same metrics are calculated the same way across every site, so a comparison between plants is actually comparable.
Dashboard views
Dashboards give both the group-level view and drill-down into a single plant, line, or shift from the same screen.
Drill-down analysis
Drill-down analysis lets a reviewer move from a group-level anomaly straight to the shift and line that caused it.
Threshold alerting
Threshold alerting triggers the moment a metric crosses tolerance, instead of waiting on the next scheduled review.
Resolution tracking
Every alert is tracked to resolution, so an exception raised at one site stays visible until it is actually closed.
From request to system of record in four steps
Capture
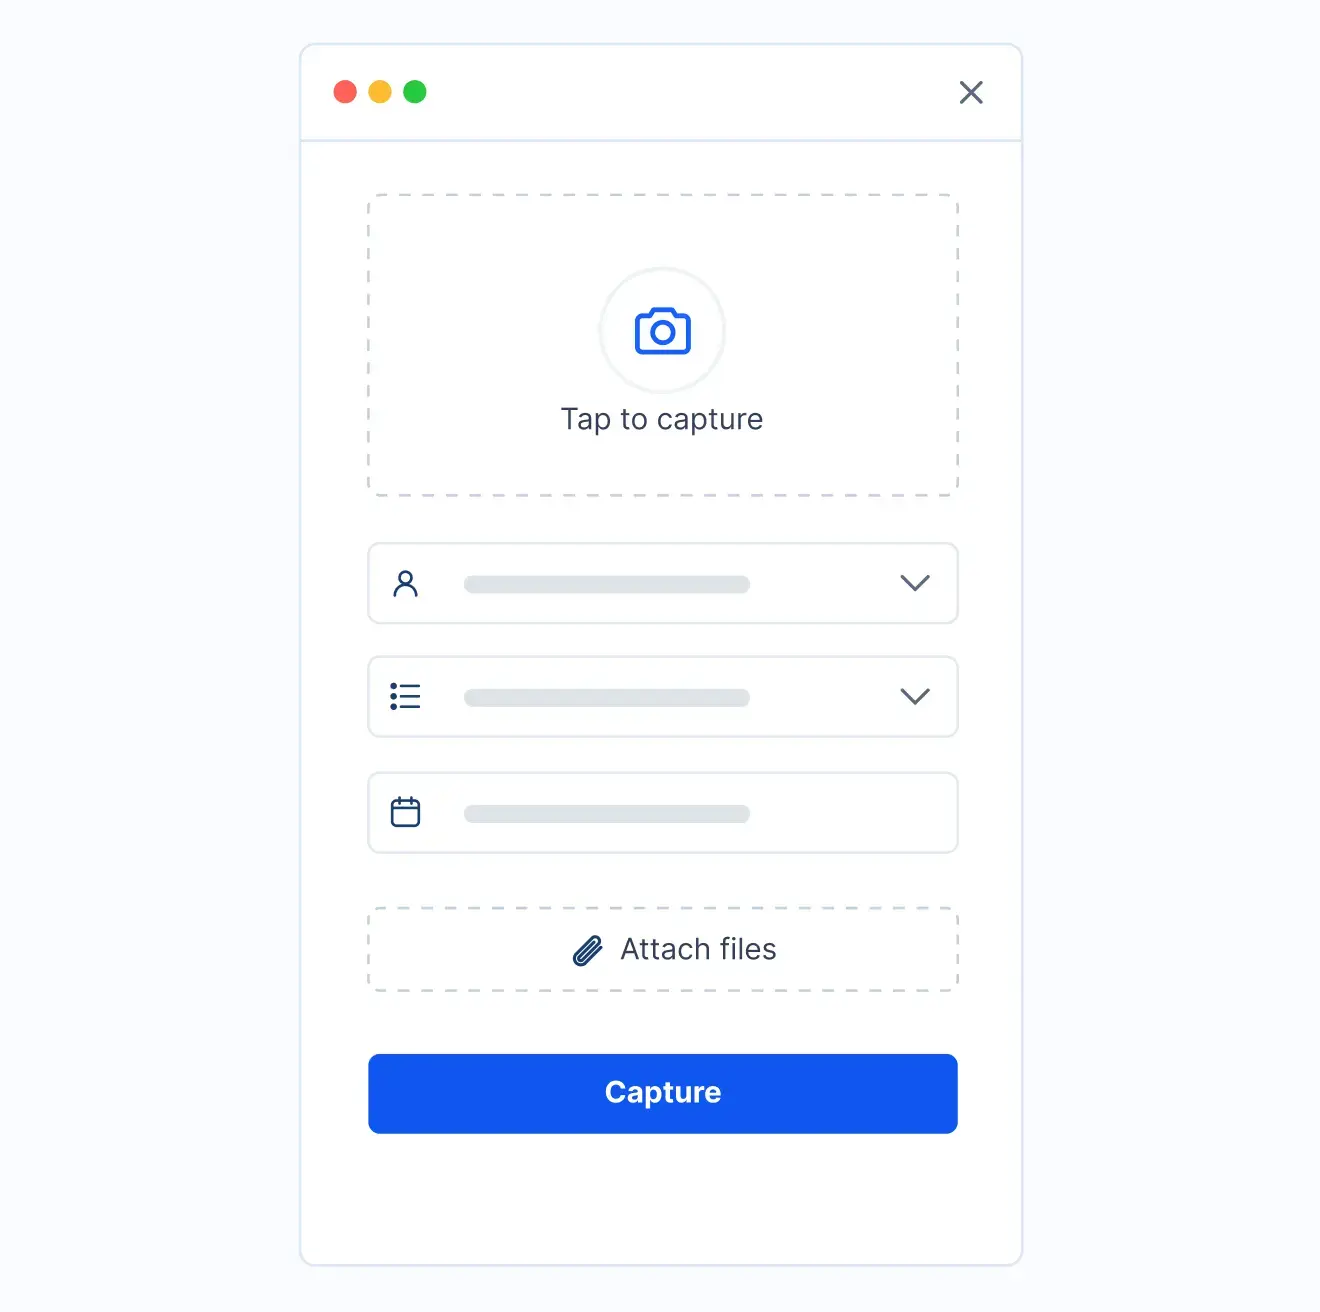
Operational data is ingested from every plant on a consistent schedule, keeping every site's numbers current.
Validate
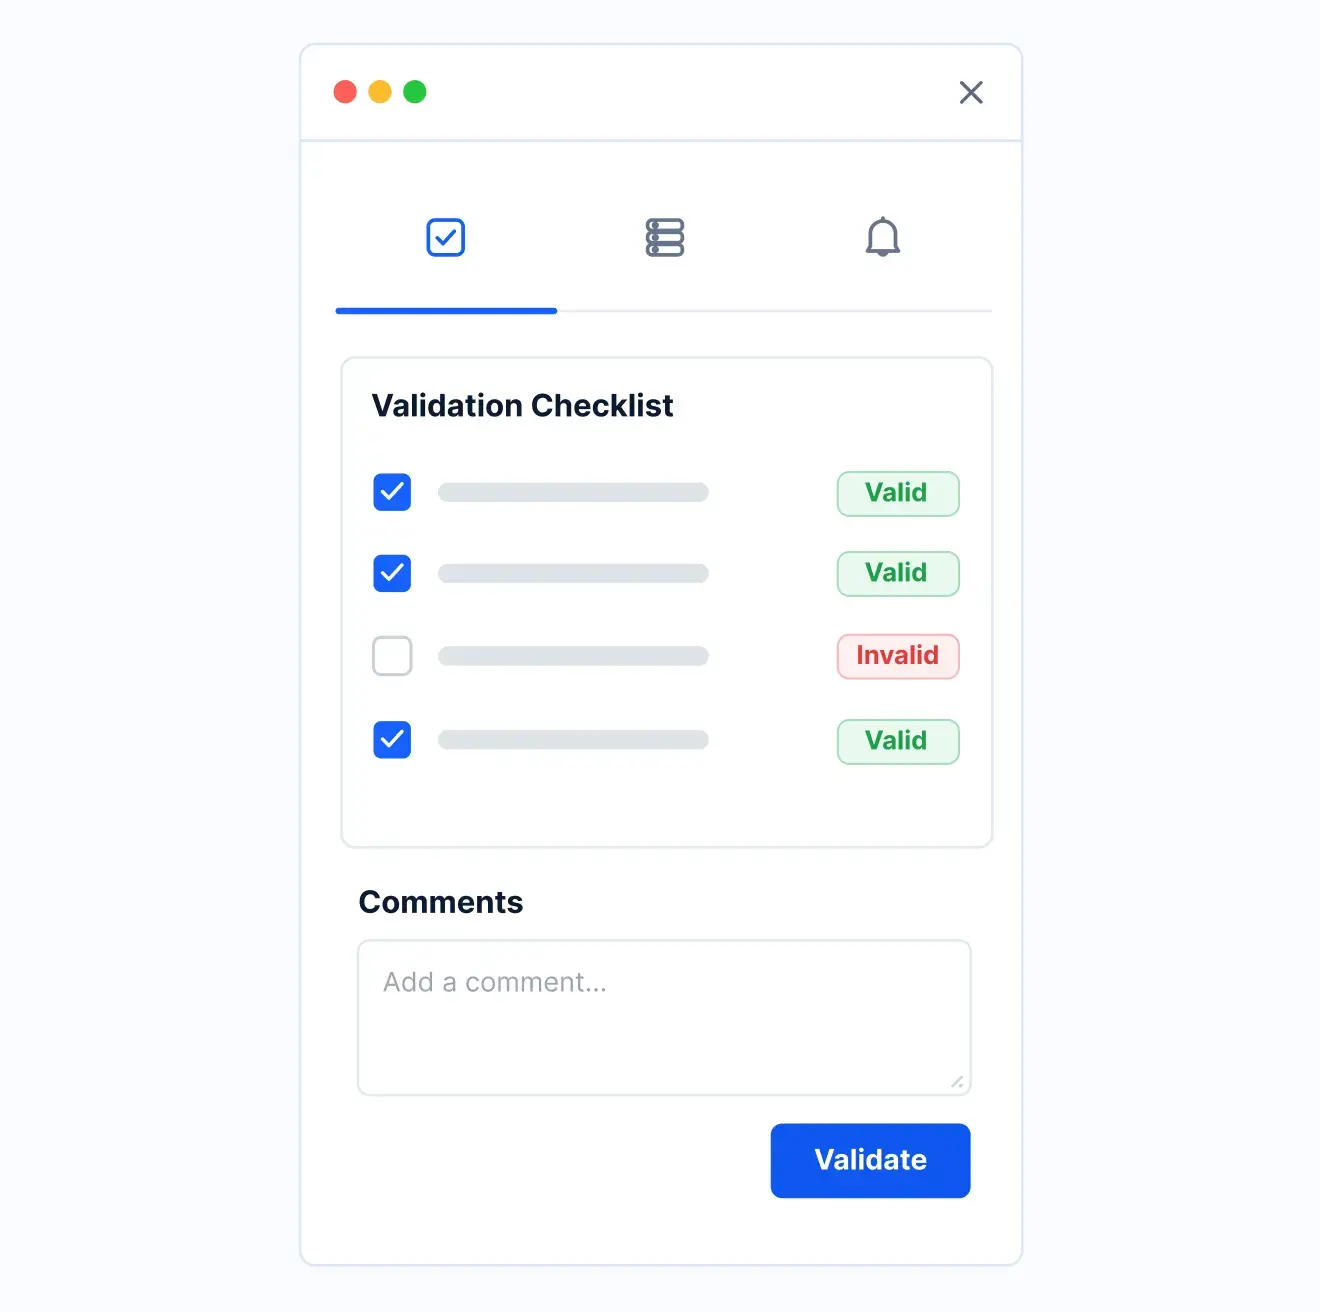
The same metrics are calculated consistently across sites, so comparisons hold up under scrutiny.
Track
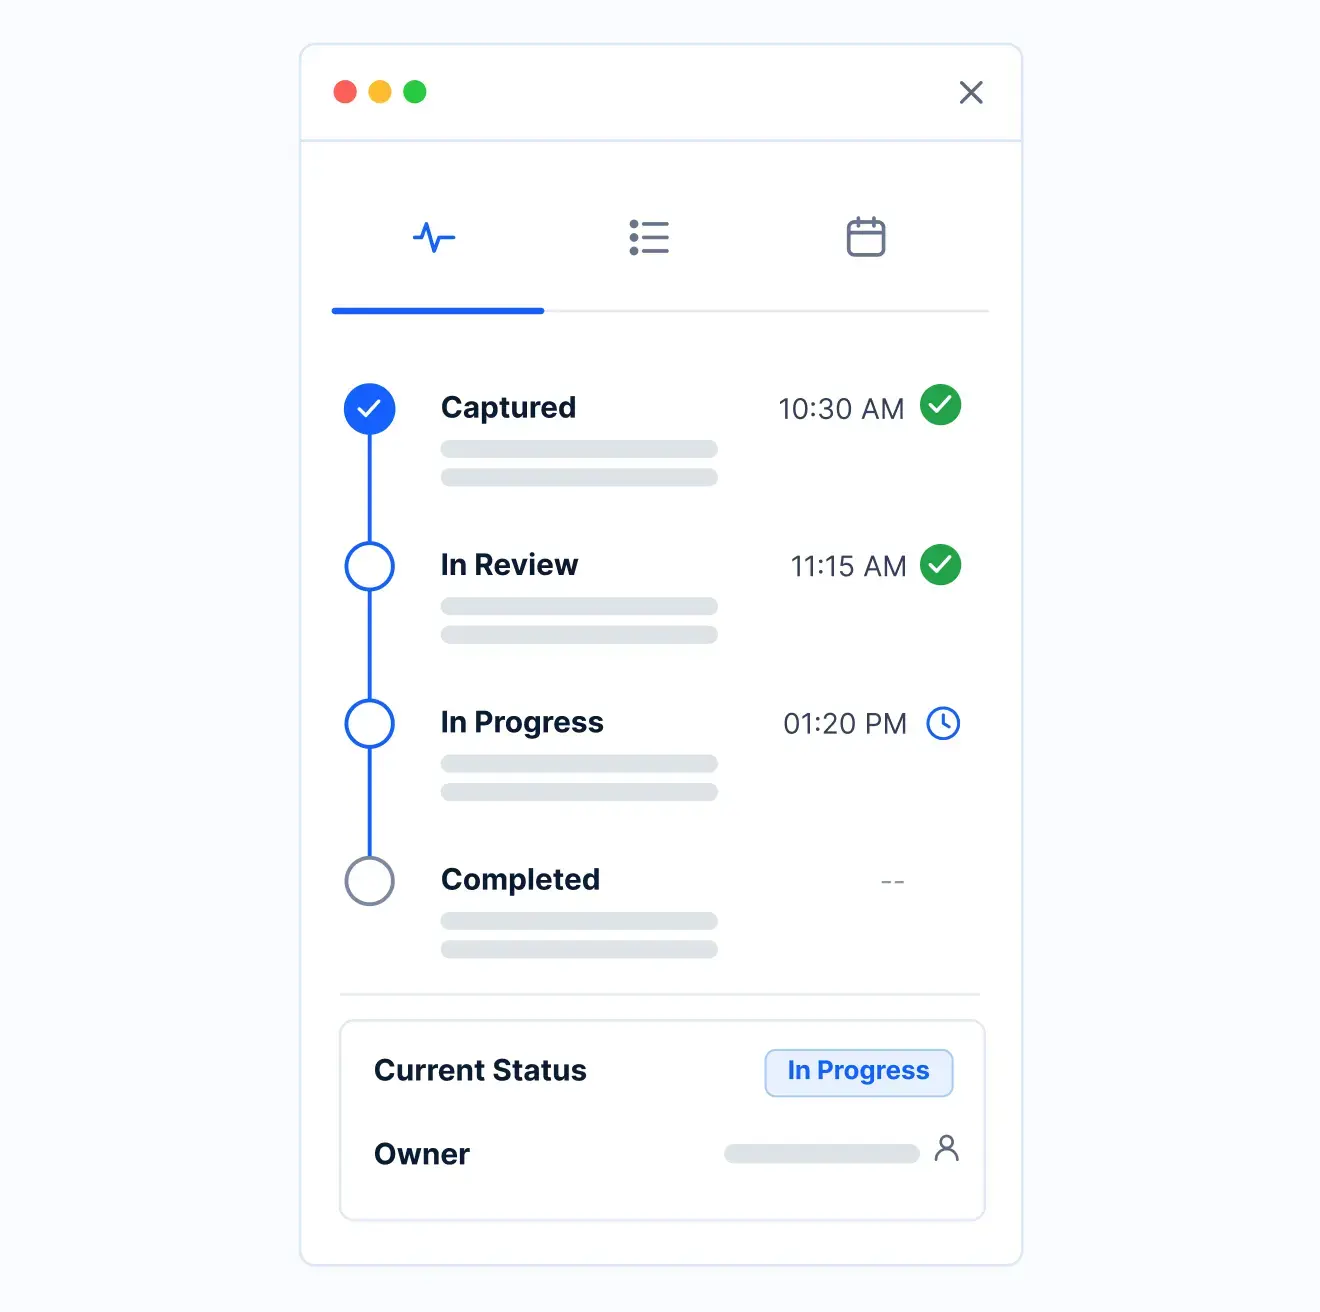
A reviewer sees the group-level dashboard and drills into the specific plant, line, or shift behind an anomaly, and a crossed threshold surfaces the exception the moment it appears.
Report
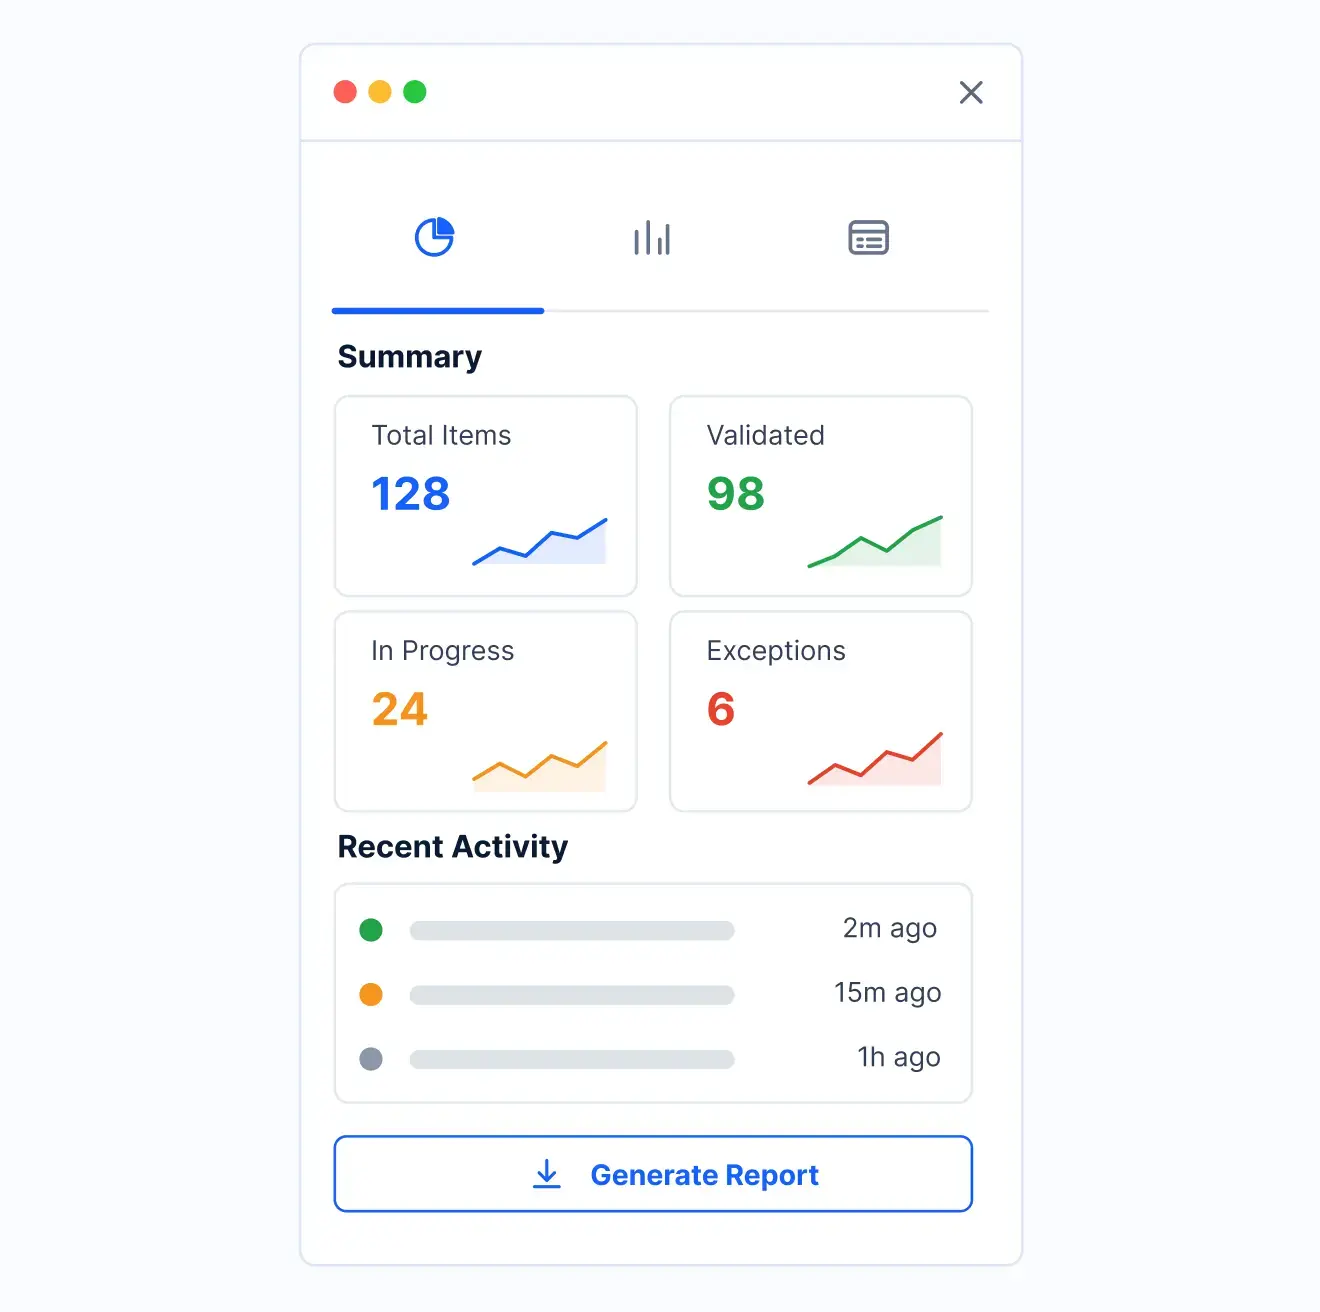
Exceptions are tracked to closure from the same network-level view the whole group already uses, and that shared dashboard is the record.
What changes when cross-plant visibility runs on Kissflow
| Process | Before Kissflow | On Kissflow |
|---|---|---|
| Data collection | Every plant tracks exceptions its own way | One dataset, pulled consistently from every plant |
| Metric comparability | Numbers don't mean the same thing site to site | The same metric, calculated the same way, everywhere |
| Reporting cadence | A manual roll-up on whatever schedule someone manages | A live dashboard, current as the underlying data |
| Pattern detection | A shared cause across plants looks like separate issues | Cross-plant patterns visible in the same view |
| Alerting | Nobody knows a plant crossed a threshold until asked | Automatic alerts when a plant crosses a defined threshold |
| Resolution | Visibility stops at the dashboard | Exceptions tracked through to a documented resolution |
Connects to the plant systems already running at every site
.svg)



.svg)
.svg)
.svg)
.svg)

.svg)
.svg)
.svg)
.svg)
.svg)

.svg)

.svg)

.svg)
.svg)
.svg)
.svg)
.svg)
.svg)
.svg)
.svg)
.svg)

.svg)
Built for how a multi-plant network actually operates
One dataset without a rip-and-replace
Data connects from each plant's existing systems, so no site has to change how it captures exceptions to participate.
Metrics that mean the same thing everywhere
The same calculation logic applies across every plant, so a comparison across sites is actually a fair one.
Live in weeks, not a re-implementation
Configure data sources, metrics, and thresholds in the visual builder, without a data warehouse project.
Alerts before the quarterly review, not during it
Threshold alerts surface a plant's rising exception rate while there's still time to act on it.
Visibility that closes the loop
Every exception the dashboard surfaces can be assigned and tracked to a resolution, not just observed.
Made for cross-team work
Plant managers, network operations, and leadership all see the same data with their own view of it.
Related apps
Real-Time Production Monitoring Dashboard
See a single plant's live production data in detail, distinct from this app's network-level roll-up across plants.
Production Deviation Logging & Escalation
Log and escalate a single plant's real-time process drift, one input this network dashboard can roll up.
Production Planning and Scheduling
Coordinate a single plant's production plan, feeding into the exception patterns this app surfaces at the network level.
We help manufacturing leaders keep the plan and the plant in sync
.gif)

“If a company cannot enable everybody to use AI, they will never get the true benefit of AI. Platforms like Kissflow allow us to put that capability in the hands of our users in a safe way.”
Vagesh Dave
GVP & CIO at McDermott International, Ltd
See The Full Story

“Advanced automation of all processes is easy to set up. I cannot imagine how to manage workflows without this software.”
Tanay Tiwary
Global Head - Digitalization & Business Improvement
See the Full Story

“Kissflow supports rapid application development by building a working application prototype in the shortest amount of time.”
Maria Theresa Cabigon
CIO, SN Aboitiz Power Group
See The Full Story
See what Kissflow can do for you
Talk to usGot questions? We're here to help.
Get SupportThe Real-Time Production Monitoring Dashboard is a single-plant, floor-level live view. This app aggregates exception data across every plant in the network into one comparable dataset, with drill-down back to any single plant.
No. Data connects from whatever system each plant already uses to track exceptions, and Kissflow normalizes it into one consistent dataset and metric set.
Any tracked deviation from plan across production, quality, maintenance, or logistics that a plant already logs, brought into one network-level view.
Access is role-based. A plant manager typically sees their own site in detail; network and executive roles see the roll-up with drill-down into any plant.
Yes. Process owners configure forms, routing, and thresholds in the visual builder, and the AI Builder can generate a working app from a plain-language description.
Through APIs and integration connectors, under single sign-on and role-based access, with every action written to an audit log.
Configuration and AI generation move delivery from weeks to days, without a multi-year platform program or an engineering backlog.
Kissflow is certified to SOC 1, SOC 2, SOC 3, ISO/IEC 27001, HIPAA, GDPR, and CCPA, hosted on Google Cloud with data residency in the US, EU, APAC, and Oceania.