Corrosion Monitoring & Thickness Reading Management System
Kissflow logs every wall-thickness reading against its monitoring location, calculates the corrosion rate automatically against the previous reading at that same point, and flags a location approaching its retirement thickness before it turns into an unplanned finding.

Trusted by energy operators worldwide





One thickness reading tells you a number. Two readings tell you a rate.
A UT technician takes a wall-thickness reading at a monitoring location on a pipe or vessel, and that single number means little on its own without the reading that came before it at the same location. A corrosion rate is a comparison across time, and if the historical readings for that location live in a different spreadsheet than the one the technician updated today, calculating the trend becomes manual work that gets skipped more often than anyone would admit.
Kissflow logs every reading against its specific monitoring location, calculates corrosion rate automatically against the prior reading at that same point, and flags a location trending toward its retirement thickness before the next scheduled inspection is the one that finds it there.
Engineering sees a trend by location, circuit, and asset instead of a table of isolated numbers, so a monitoring location accelerating toward retirement gets flagged while there is still time to plan a repair or a re-rating rather than reacting to an unplanned finding.
Where a corrosion trend goes unnoticed between readings
Readings are isolated data points
Each thickness reading gets recorded without automatic comparison to the last one.
Corrosion rate is manual math
Someone has to pull two readings and calculate the rate by hand, if they do it at all.
Retirement thickness is not tracked
A location approaching minimum thickness is not flagged until a scheduled inspection finds it.
No location-level history
A monitoring location's full reading history is scattered across inspection reports.
Six modules. Every reading tied to a location and a calculated corrosion rate.
Configure monitoring locations and retirement thresholds by asset.
Monitoring location register
Every UT monitoring location is registered against its specific asset, circuit, and full prior reading history.
Reading capture
Each thickness reading is logged against its exact monitoring location and date, building a genuine trend line over time.
Corrosion rate calculation
Corrosion rate is calculated automatically from the current reading against the prior one recorded at that point.
Threshold monitoring
A location trending toward its retirement thickness is flagged the moment the trend line actually shows it.
Escalation
A flagged location routes automatically for engineering review, well ahead of the next scheduled inspection cycle.
Trend reporting
A dashboard shows corrosion trend by location, circuit, and asset across the entire monitoring program at once.
From request to system of record in four steps
Capture
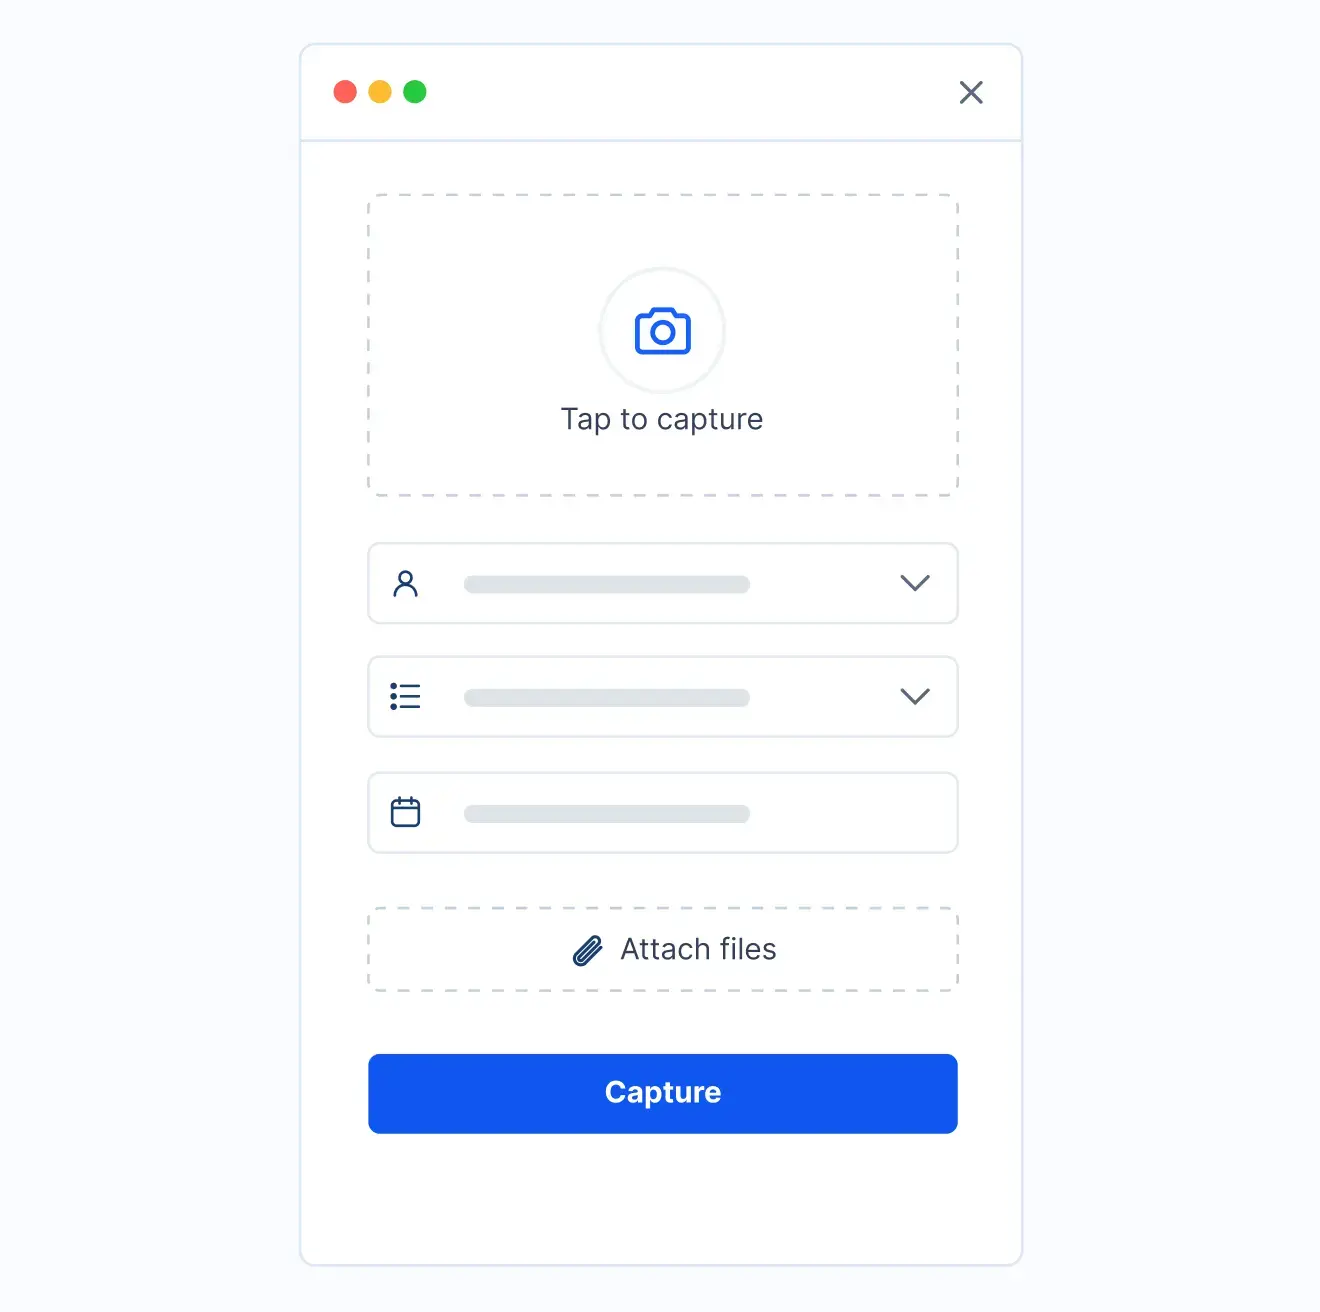
A wall-thickness reading is captured against its exact monitoring location and date.
Validate
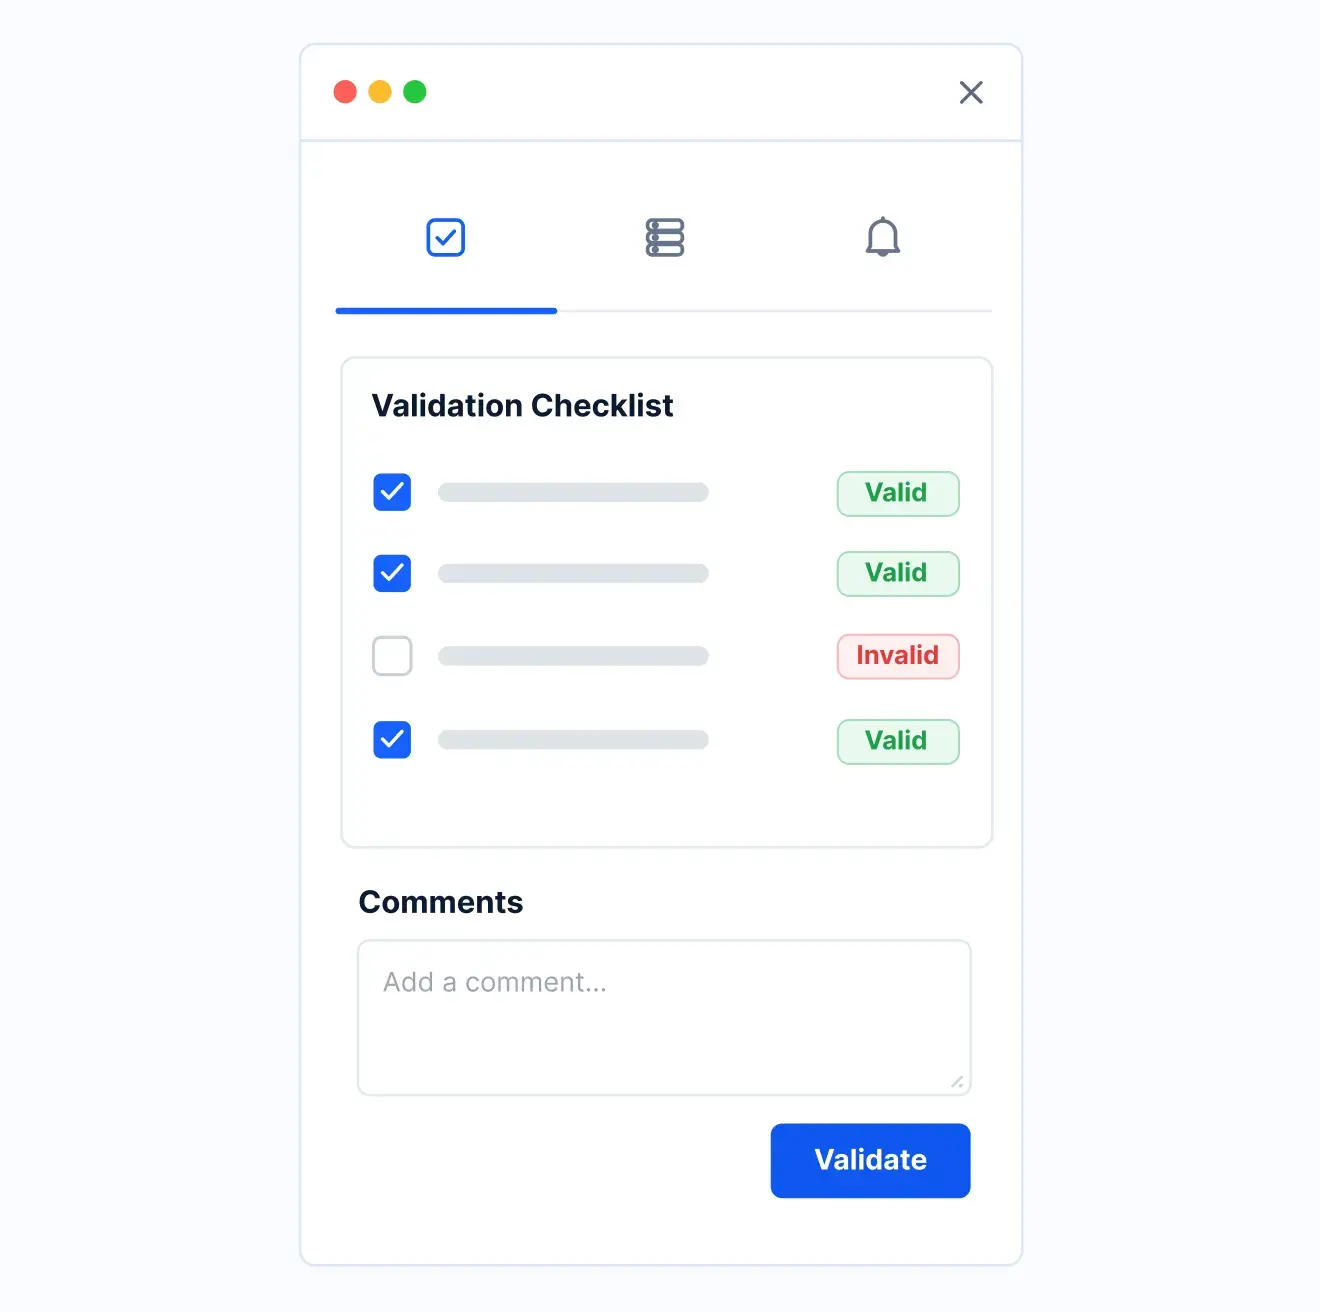
The corrosion rate is calculated automatically against the prior reading at that same point.
Track
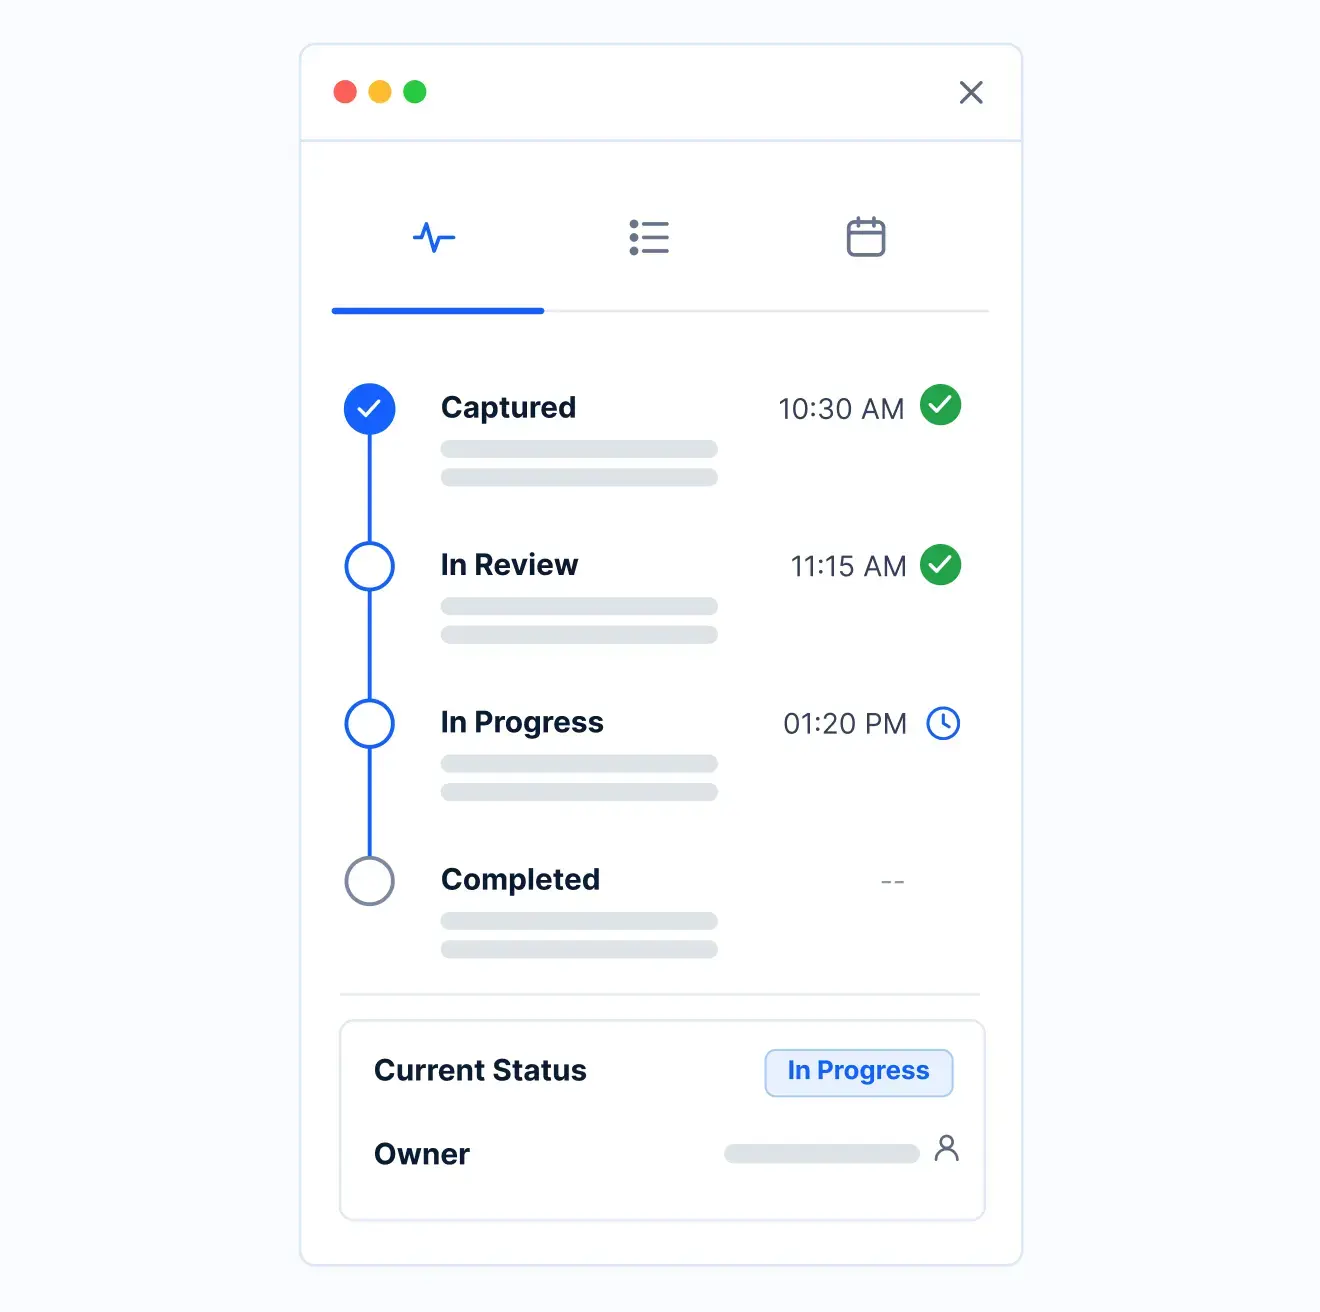
A location approaching its retirement thickness is flagged as soon as the trend forms, and engineering reviews it.
Report
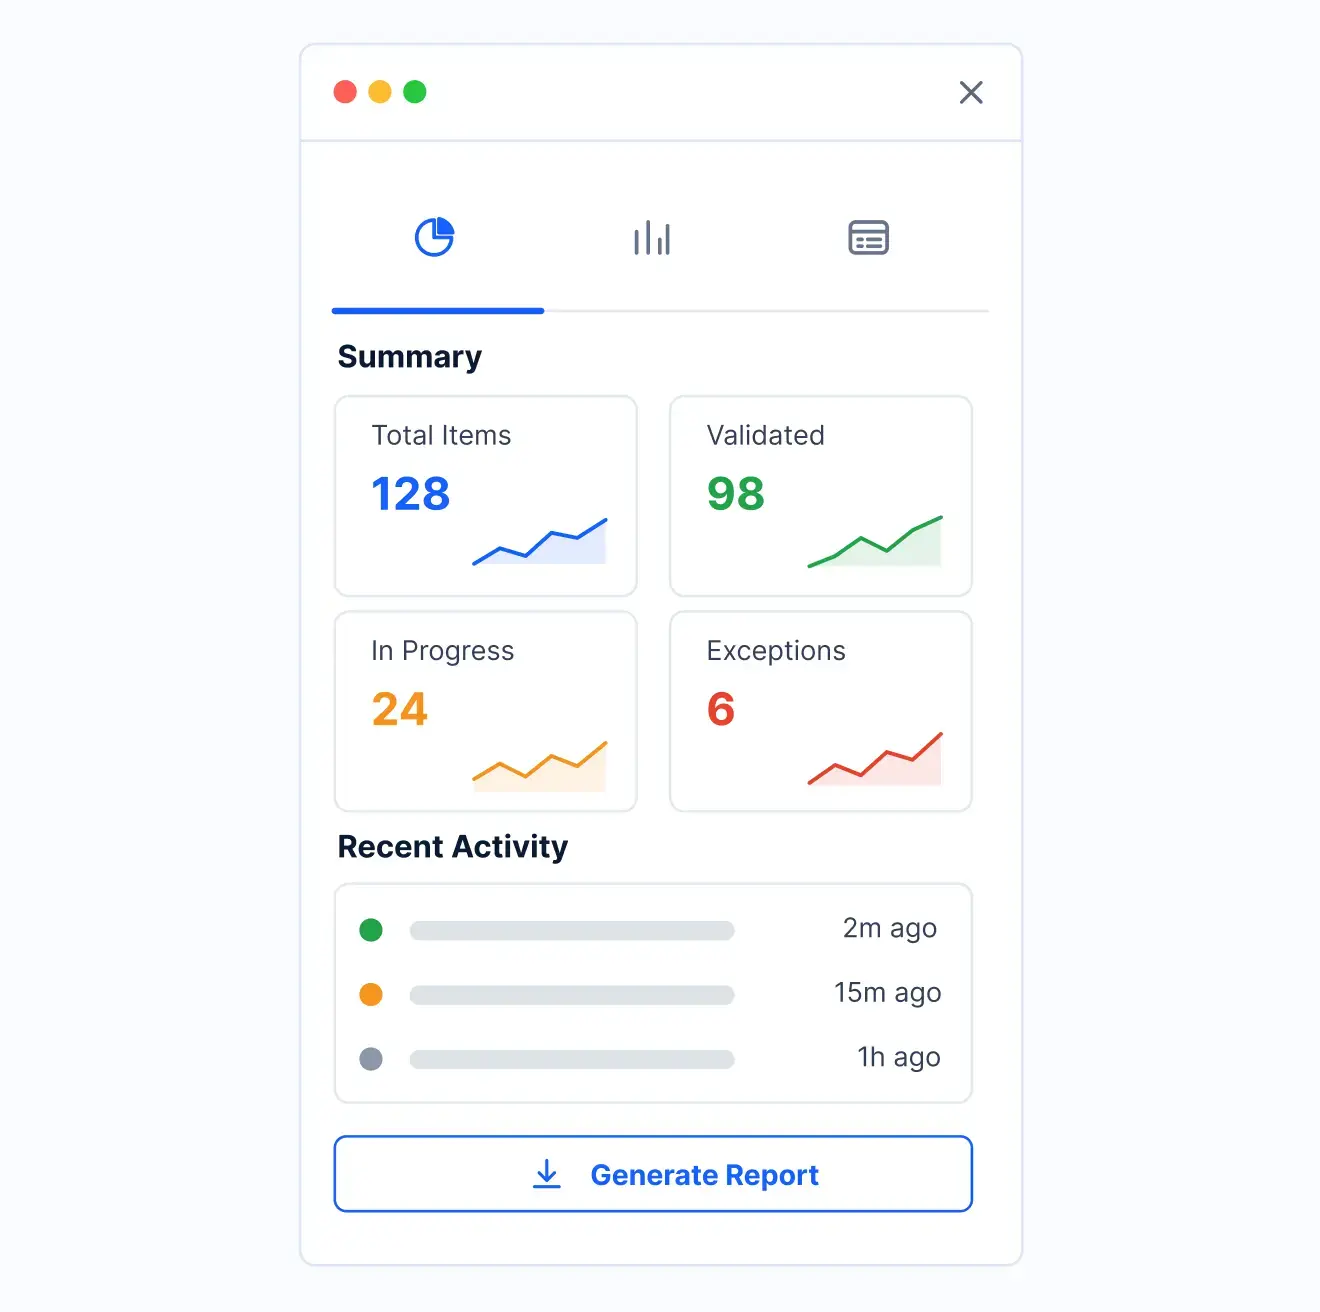
Trends roll up by asset and circuit for planning, with the reading register standing as the integrity system of record.
What changes when corrosion monitoring runs on Kissflow
| Process | Before Kissflow | On Kissflow |
|---|---|---|
| Reading record | An isolated data point | Logged against its location and prior history |
| Corrosion rate | Calculated by hand, if at all | Calculated automatically from consecutive readings |
| Retirement threshold | Discovered at a scheduled inspection | Flagged as a location trends toward it |
| Location history | Scattered across reports | One continuous record per location |
| Escalation | Informal | Routed to engineering automatically |
| Trend visibility | None | A dashboard by location, circuit, and asset |
Connects to your inspection data management and RBI systems; Kissflow does not replace your engineering system of record
Kissflow runs the reading, rate-calculation, and threshold-alert layer. Your IDMS and RBI program stay the system of record for engineering assessment.
.svg)



.svg)
.svg)
.svg)
.svg)

.svg)
.svg)
.svg)
.svg)
.svg)

.svg)

.svg)

.svg)
.svg)
.svg)
.svg)
.svg)
.svg)
.svg)
.svg)
.svg)

.svg)
Built for how a corrosion trend actually needs two readings to see
Rate calculated automatically
A trend is visible without someone pulling two reports and doing the math.
Flagged before the next inspection finds it
A location trending toward retirement thickness is caught early.
A real history per location
Every reading at a monitoring location builds one continuous trend.
Live in weeks
Configure monitoring locations in the visual builder, or describe the use case to the AI Builder.
Governed from day one
Role-based access and a full audit trail on every reading.
One view for inspection and engineering
Every location's trend visible to everyone who needs it.
Related apps
Asset Integrity & Risk-Based Inspection (RBI) Program Management System
Feed corrosion rate data into the RBI risk ranking.
Cathodic Protection Monitoring System
Monitor the electrochemical protection that slows corrosion before it starts.
Relief Valve / PSV Inspection & Test Register Management System
Track a separate safety-critical device inspection program.
We help inspection teams see a corrosion trend, not just a single reading
.gif)

“If a company cannot enable everybody to use AI, they will never get the true benefit of AI. Platforms like Kissflow allow us to put that capability in the hands of our users in a safe way.”
Vagesh Dave
GVP & CIO at McDermott International, Ltd
See The Full Story

“Advanced automation of all processes is easy to set up. I cannot imagine how to manage workflows without this software.”
Tanay Tiwary
Global Head - Digitalization & Business Improvement
See the Full Story

“Kissflow supports rapid application development by building a working application prototype in the shortest amount of time.”
Maria Theresa Cabigon
CIO, SN Aboitiz Power Group
See The Full Story
See what Kissflow can do for you
Talk to usGot questions? We're here to help.
Get SupportNo. Your IDMS and RBI program stay the system of record for engineering assessment. Kissflow runs the reading, rate-calculation, and threshold-alert layer.
Cathodic protection monitors the electrochemical system that prevents corrosion. This app monitors physical wall thickness, which detects corrosion that has already occurred.
Yes, rate is calculated from consecutive readings at the same monitoring location.
Yes, a threshold is configured per location and an alert fires as the trend approaches it.
Yes, every reading at a monitoring location builds a continuous, queryable history.
Yes, corrosion rate data from this app can inform a connected RBI program.
Configuration and AI-assisted app generation move delivery from a multi-month program to a matter of weeks.
Kissflow is certified to SOC 1, SOC 2, SOC 3, and ISO/IEC 27001, with role-based access on every record.