
Your Guide to Business Process Diagrams
A business process diagram visually maps the sequence of tasks, decision points, and roles within a workflow. Common formats include flowcharts and BPMN diagrams that help teams understand, communicate, and improve processes before implementation or automation. Read the blog to understand how to create effective business process diagrams and which format suits your needs.
Picture this: your most critical business process just broke down, and nobody on your team can agree on how it's supposed to work. Sound familiar? You're facing the hidden cost of undocumented processes – a problem that costs U.S. businesses an estimated $3 trillion annually in lost productivity, according to IDC research.
As a CIO or business leader, you need more than tribal knowledge and scattered emails to run efficient operations. Business process diagrams transform your invisible workflows into clear, actionable roadmaps that eliminate confusion, reduce errors, and give you the visibility needed to make data-driven improvements.
What is BPMN?
Business Process Model and Notation (BPMN) is a standardized graphical notation system that uses specific symbols, flowcharts, and diagrams to visually represent, document, and communicate business processes across technical and non-technical stakeholders in organizations.

What is a business process diagram?
A business process diagram is a visual representation tool that maps out the sequential flow of activities, decisions, and interactions within a business workflow, helping organizations document, analyze, and optimize their operational procedures for improved efficiency and clarity.
It's a key aspect of Business Process Management (BPM), which focuses on optimizing workflows, improving productivity, and identifying bottlenecks. BPM tools are often used to digitize and automate these processes for streamlined operations.
Why should you diagram a business process?
Nearly everyone has an answer to the question, “How should this process run?”. But if your explanation is only verbal or text-based, you are missing out on a lot.
By creating a visual business process flow diagram, you unlock your mind to actually see the invisible road that your data is travelling.
Business Process Diagram Example – Notice this difference between typing out this process:
And seeing this visual:
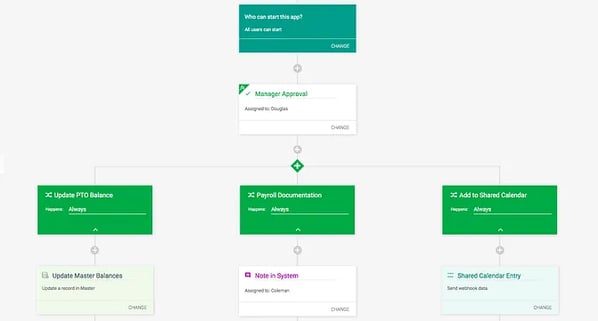
Your business process diagram can quickly show the sequence of tasks, if they are conditional, if they are done simultaneously, if they are a system task, or assigned to a human.

9 Work Automation Success Stories- Case Study

Thank you for reaching us!
Thank you for reaching us!
4 Steps to Create a Business Process Flow Diagram
1. Make a rough draft on paper
It’s often helpful to start with an easily editable visual of what you think the business process diagram should look like.
2. Get input from stakeholders
Everyone involved in the process will have a different insight to share.
3. Digitize the process
Enter the information into a BPM tool to show the relationship between tasks.
4. Assign roles and conditions
Who should do each task? Should it be a person or a system? Do the tasks need to happen every time?
Example of business process diagrams: Invoice approval
The invoice approval process in an organization can require many steps before the payment is actually processed and released to the vendor. By breaking down the entire process with a process diagram, it can become easier to identify bottlenecks and inefficiencies.
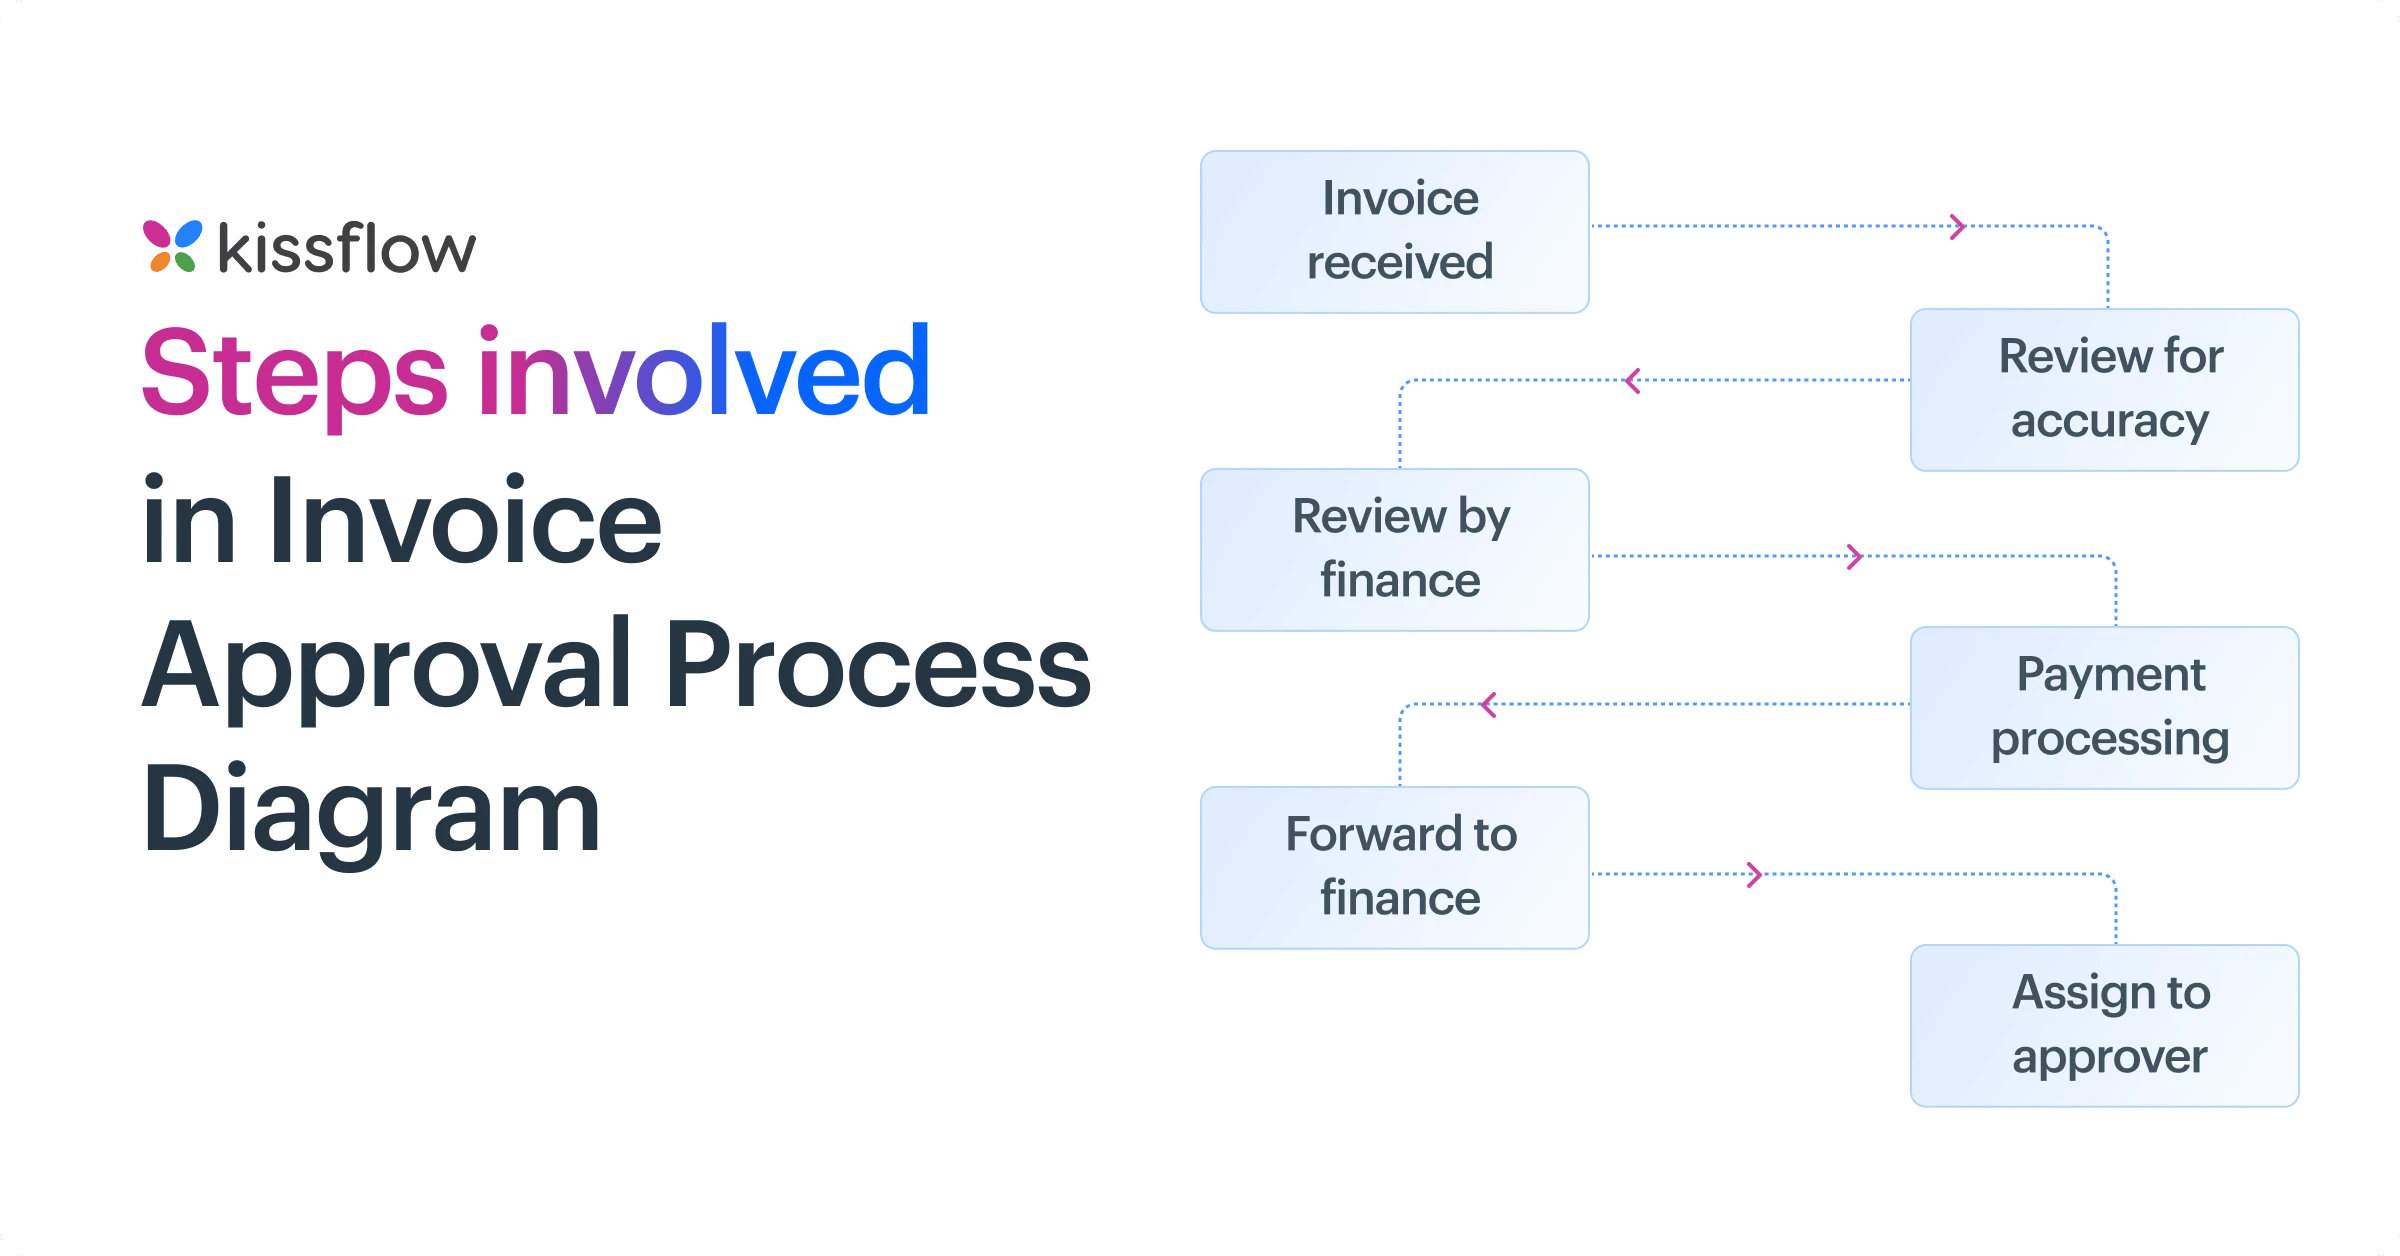
Here are the steps involved in the invoice approval process diagram:
- Invoice received: The company receives the invoice from the vendor or supplier.
- Review for accuracy: The invoice is then reviewed automatically to ensure all the billed items, invoice format, and account details are correct. If there are any discrepancies, the invoices can be rejected and returned.
- Assign to approver: After the initial check, the invoice is assigned to the approver, who then manually reviews the invoice.
- Forward to finance: When the approver reviews and approves the invoice, it is directly forwarded to the finance team.
- Review by finance: The finance team reviews the invoice for compliance and approval.
- Payment processing: The finance team processes the payment
- Process ends: Once the payment is cleared, the process ends.
Use Kissflow for Your Business Process Diagrams
Kissflow is a low-code platform that can digitize and streamline business processes with minimal coding. Its intuitive drag-and-drop form builder allows you to build complex processes that align with your business process diagrams in just a few clicks.
The powerful analytics and reporting tools by Kissflow allow you to monitor processes in real-time, identify potential problems, and make data-driven decisions. Implementing the right process automation software helps organizations streamline repetitive workflows, minimize errors, and free up teams to focus on strategic initiatives. It creates consistency and efficiency across everyday business operations.
Solve your workflow challenges with Kissflow platform and optimize your team's productivity.
Related topics:
Business Process Design | How to Design Business Processes?
Business Process Modeling: Definition & Benefits
Business Process (BPM) Simulation: A Risk-free Method to Test Your Radical Ideas
Types of Business Process Diagramming Tools: Here's How to Choose!
Business Process Flow Diagram Guide
Frequently Asked Questions
1. What are the different types of business process diagrams?
Business process diagrams include flowcharts showing sequential steps and decision points, swimlane diagrams clarifying role responsibilities, value stream maps highlighting waste and delays, BPMN (Business Process Model and Notation) diagrams with standardized symbols, data flow diagrams showing information movement, and SIPOC (Supplier-Input-Process-Output-Customer) diagrams providing high-level process views.
2. How do process diagrams improve workflow efficiency?
Process diagrams improve workflow efficiency by creating visual clarity about how work should flow, identifying redundant steps and bottlenecks, establishing clear handoff points between departments, documenting decision criteria at key points, providing a baseline for measuring improvement efforts, and creating a common understanding among all participants about their roles and responsibilities.
3. What are the best tools for creating business process diagrams?
The best tools for creating business process diagrams offer intuitive drag-and-drop interfaces, extensive symbol libraries supporting multiple diagram types, collaboration features for stakeholder input, version control tracking changes over time, simulation capabilities to test process changes, integration with process execution platforms, and export options for documentation and presentations.
4. How can process diagrams simplify complex workflows?
Process diagrams simplify complex workflows by breaking them into clear, manageable steps, using visual representation to show relationships between activities, clarifying decision points and their criteria, defining roles and responsibilities at each stage, highlighting parallel activities that can happen simultaneously, and creating a common language for discussing process improvements across departments.
5. What are best practices for designing process diagrams?
Best practices for designing process diagrams include starting with clear process boundaries, using consistent notation appropriate for the audience, maintaining appropriate detail level (not too simplistic or complex), validating diagrams with actual process participants, including exception handling for non-standard scenarios, documenting assumptions and decision criteria, and connecting diagrams to measurable performance metrics.
6. Why are business process diagrams essential before automation?
They reveal dependencies, delays, ownership gaps, and exception paths. Automating without a diagram risks scaling inefficiencies and missing critical steps, especially in cross-team workflows.
7. What should a process diagram capture beyond task steps?
Roles, handoffs, decision points, exceptions, SLAs, and system dependencies—these define automation logic and governance needs.
8. How do diagrams reduce misalignment between IT and business?
Both teams validate the same visual logic early, preventing requirement mismatches later.
9. How does process diagramming help leaders prioritize automation?
Diagrams highlight bottlenecks and high-effort manual steps, helping CIOs focus on high-impact workflows first.
10. How often should enterprises update process diagrams?
Whenever policies, approvals, or tools change. Living diagrams prevent automation drift.
.webp?width=285&height=570&name=Kissflow-BPM-g2-review-white%20(2).webp)
Related Articles


4 MINUTES READ
Business Process Flow Diagram Guide


%20(1)%20(1).png?width=1997&height=1800&name=The%20ultimate%20buyers%20guide%20to%20BPM%20(1)%20(1)%20(1).png)
