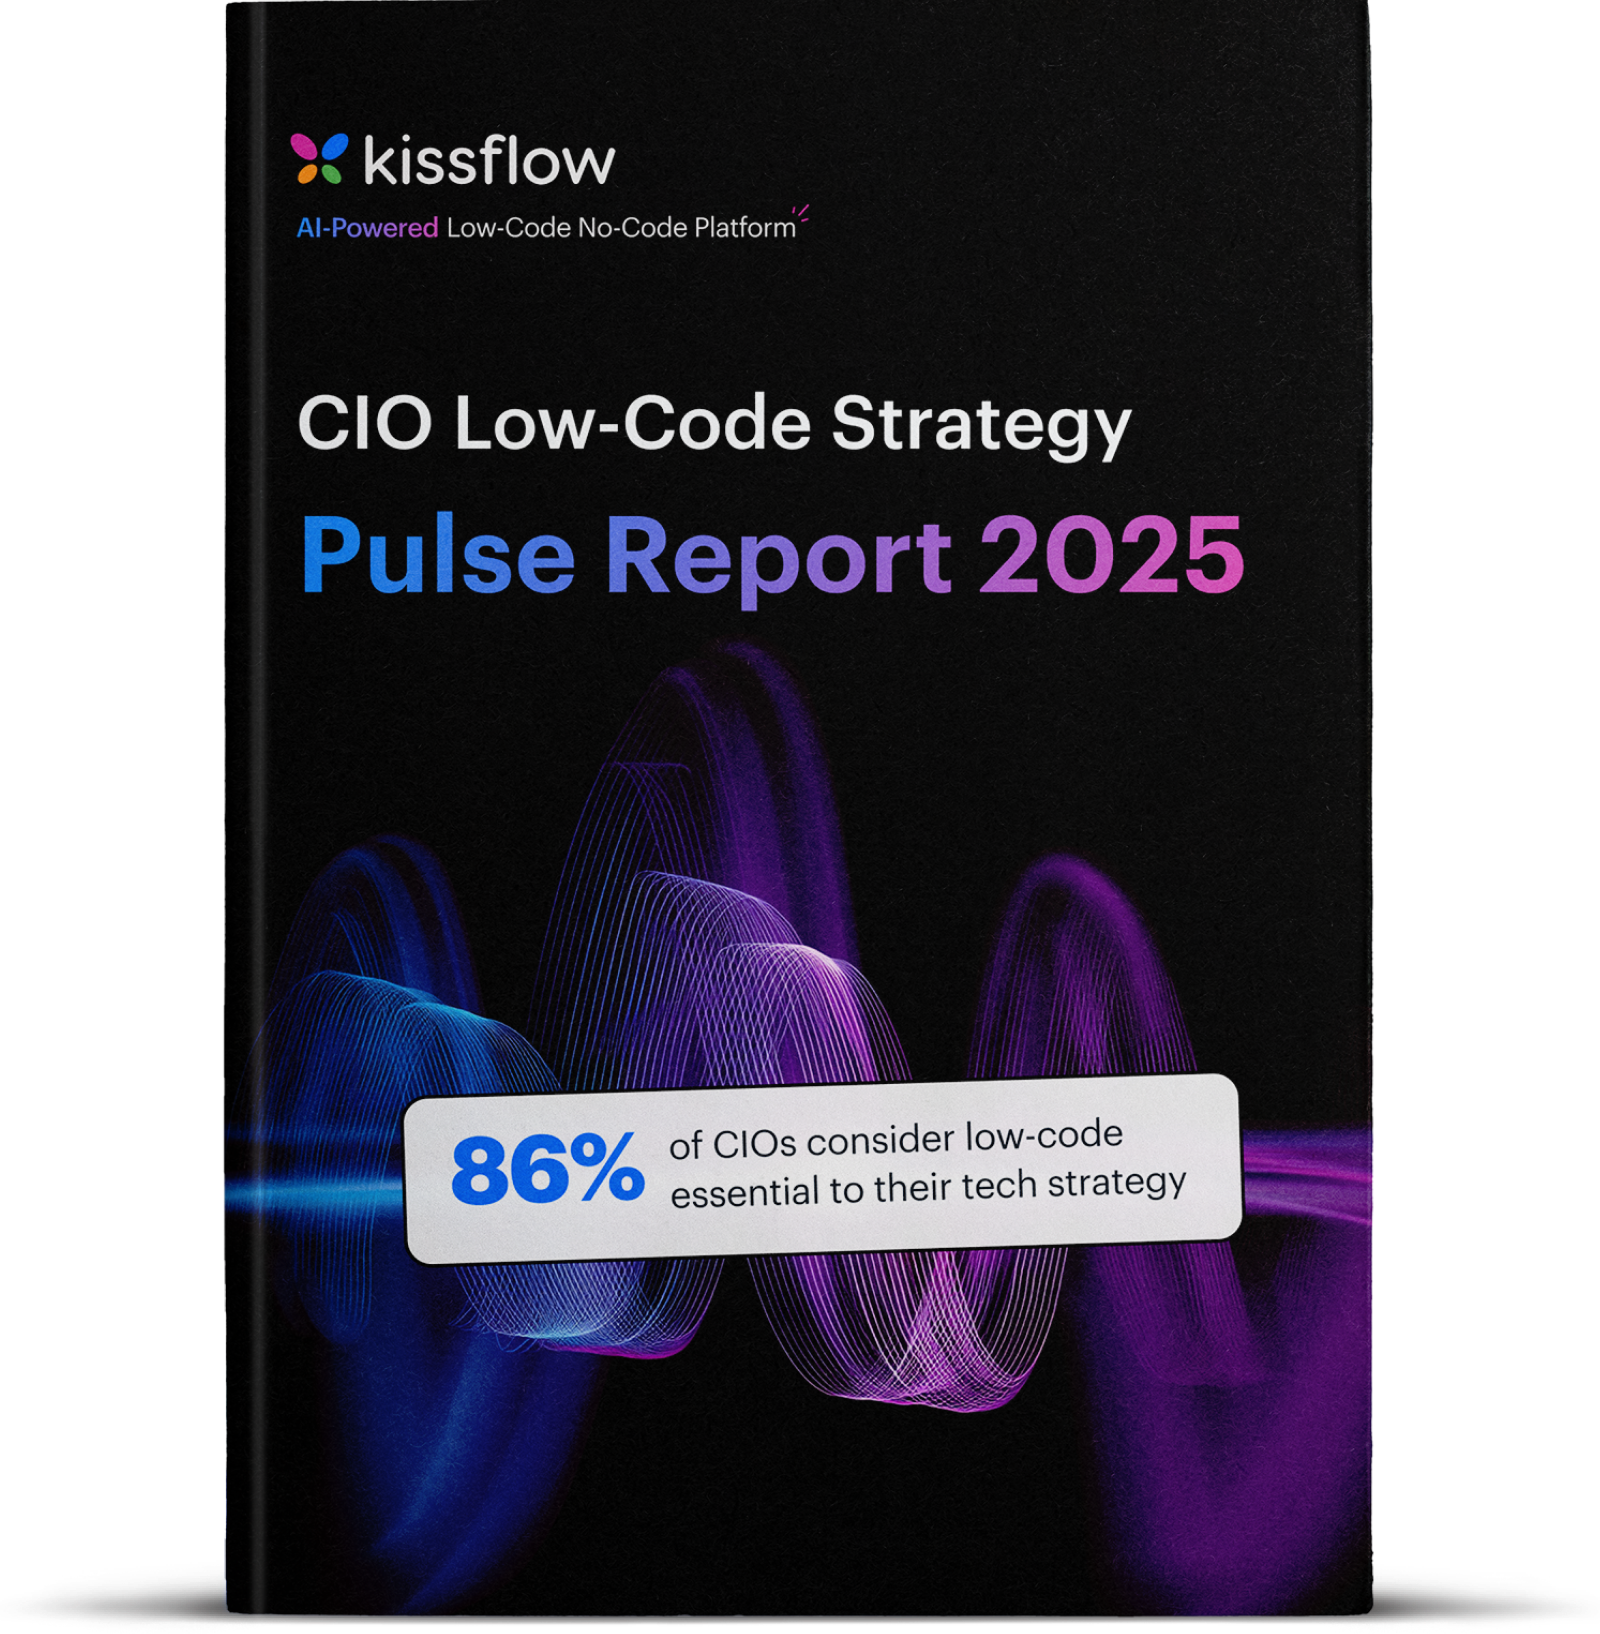
Store-wise Maintenance Performance Dashboard for Retail Chains
Kissflow rolls up mean time to repair, repeat-failure rate, and maintenance cost by individual store, giving facilities leadership a ranked view of which locations are running efficiently and which need attention, drawn directly from the maintenance suite's own data.
Trusted by leading retailers worldwide


One slow store hides inside a chain-wide average until someone ranks the stores individually.
A chain-wide average repair time can look perfectly healthy on a monthly report while one specific store consistently takes three times as long as every other location to get a repair resolved, or keeps racking up repeat failures on the exact same piece of equipment. Averages are good at hiding outliers, and without a store-by-store ranking sitting underneath that average, one persistently underperforming location stays invisible until it becomes a bigger, visible problem, a customer complaint, a safety issue, or an equipment failure nobody saw coming because the warning signs never got aggregated in one place.
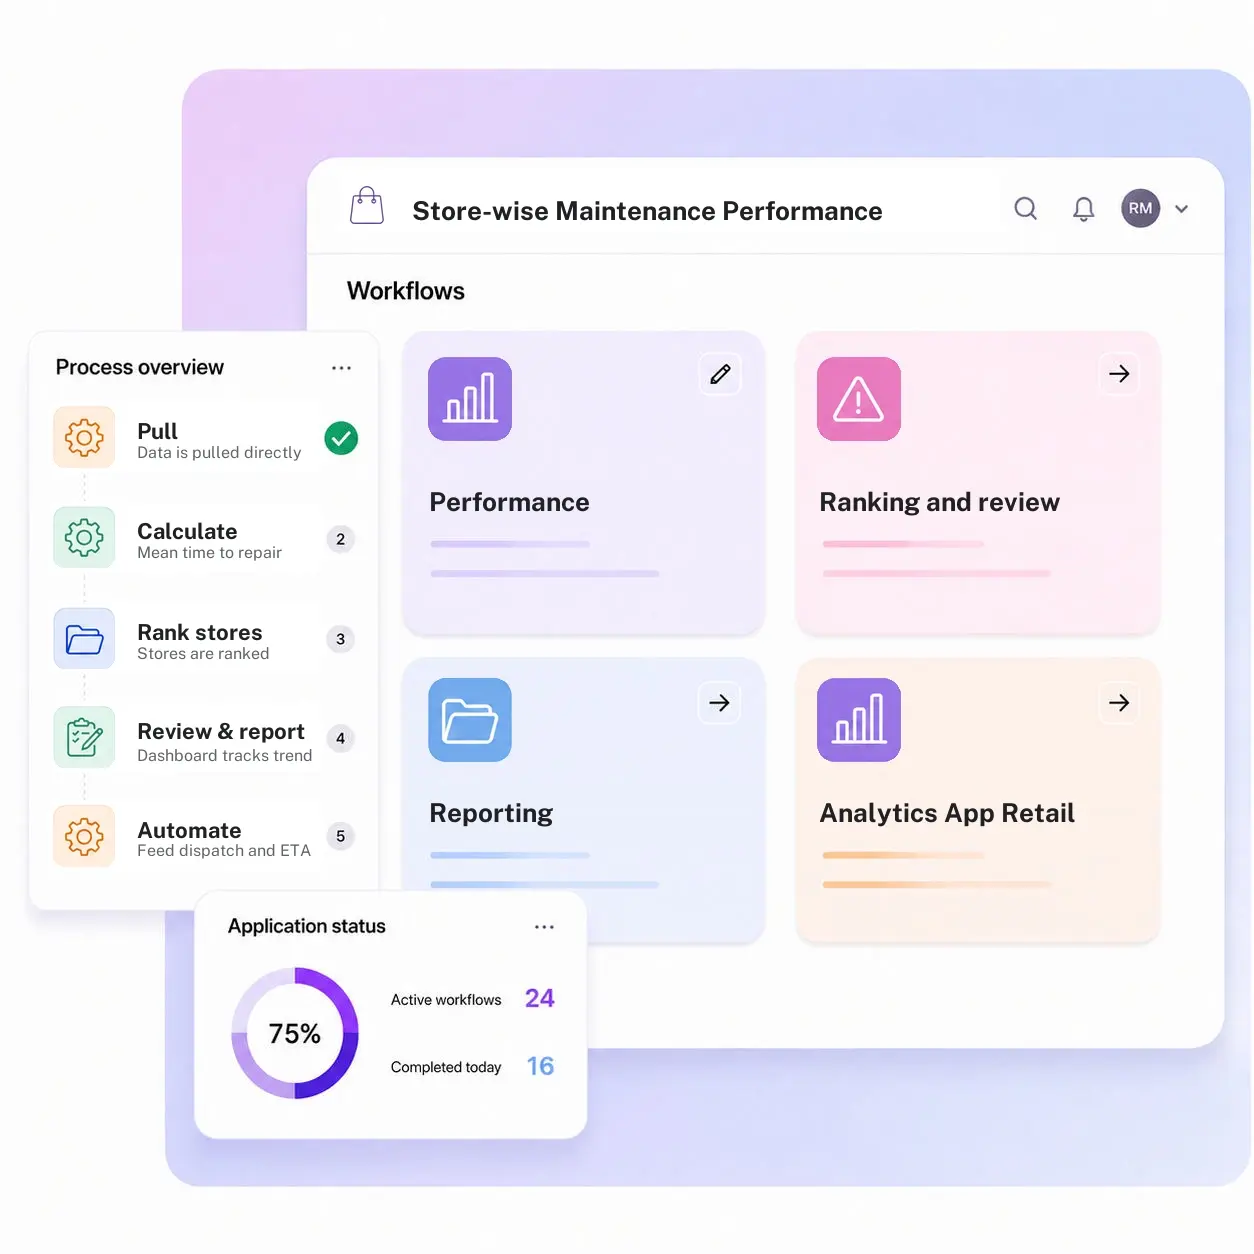
Kissflow pulls performance data directly from across the maintenance suite, work orders, technician dispatch, vendor coordination, and calculates mean time to repair, repeat-failure rate, and total maintenance cost for every store individually rather than blended into a single number. Stores are ranked against each other on those three measures, outliers are flagged automatically for review, and a trend dashboard supports a regional performance review where facilities leadership sees exactly which locations need attention before a small pattern becomes an expensive one.
Where a maintenance problem store hides inside a chain-wide average
Performance is measured chain-wide, not per store
An average hides which specific store is actually struggling.
Repeat failures are not tracked as a pattern
The same equipment failing repeatedly at one store does not get flagged.
Cost is not compared across stores
Nobody notices one store spending disproportionately more on maintenance.
Reviews happen too late
A store's maintenance problem surfaces only after it becomes a bigger operational issue.
Three modules. Every store ranked on real maintenance performance, not a chain-wide average.
Configure performance metrics and review cadence by region.
Performance measurement
Mean time to repair, repeat-failure rate, and total maintenance cost are calculated per store, not blended.
Ranking and review
Stores are ranked against each other on those measures, and outlier locations are flagged for review.
Reporting
A trend dashboard tracks performance over time and supports a scheduled regional performance review.
From request to system of record in four steps
Capture
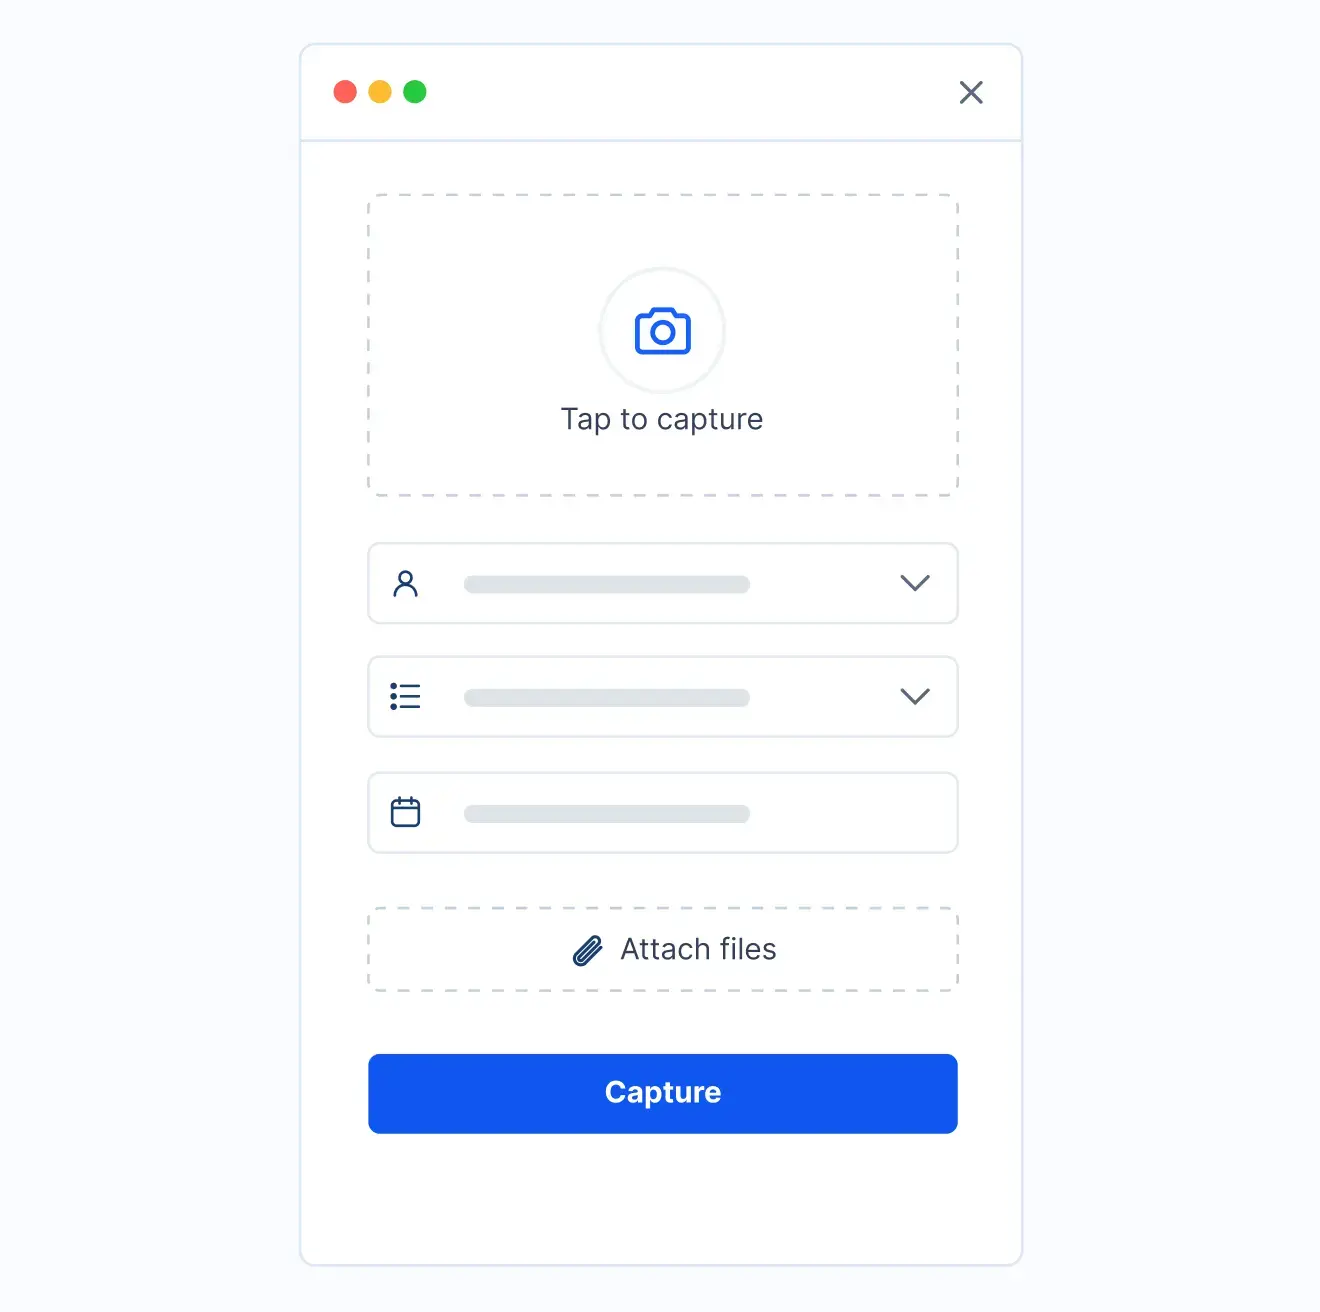
Data is pulled directly from work orders, dispatch records, and vendor coordination in the maintenance suite.
Validate
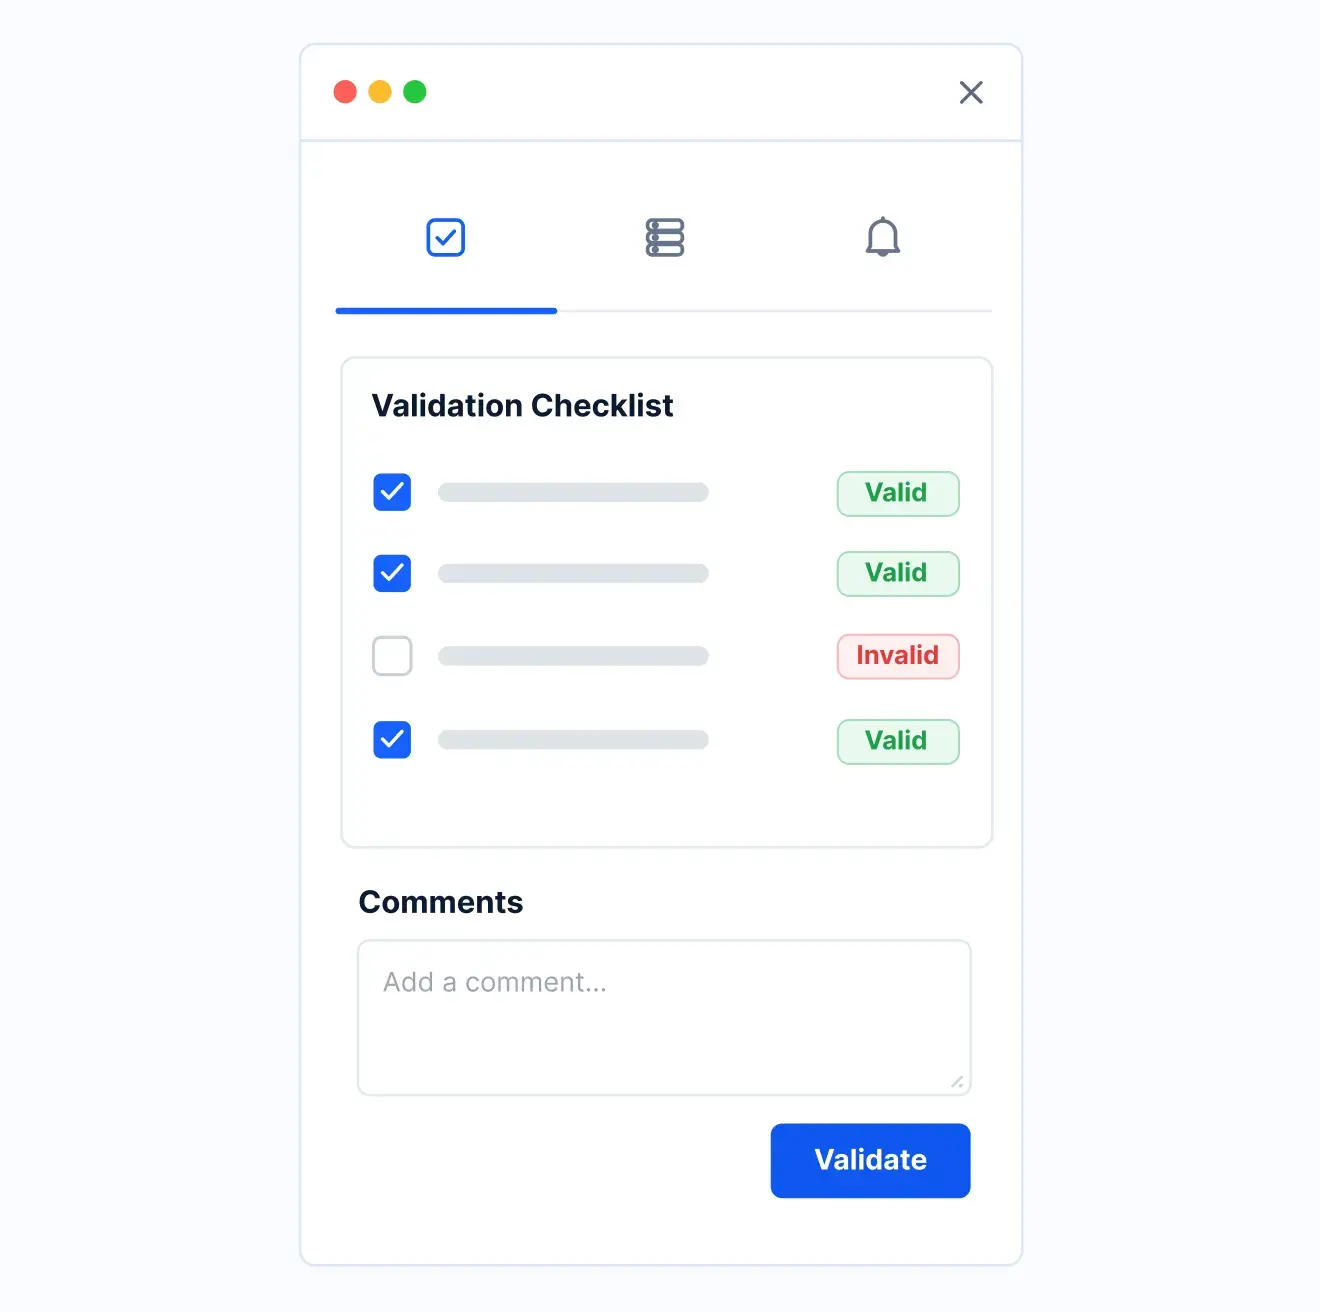
Mean time to repair, repeat-failure rate, and cost are calculated separately for each store.
Track
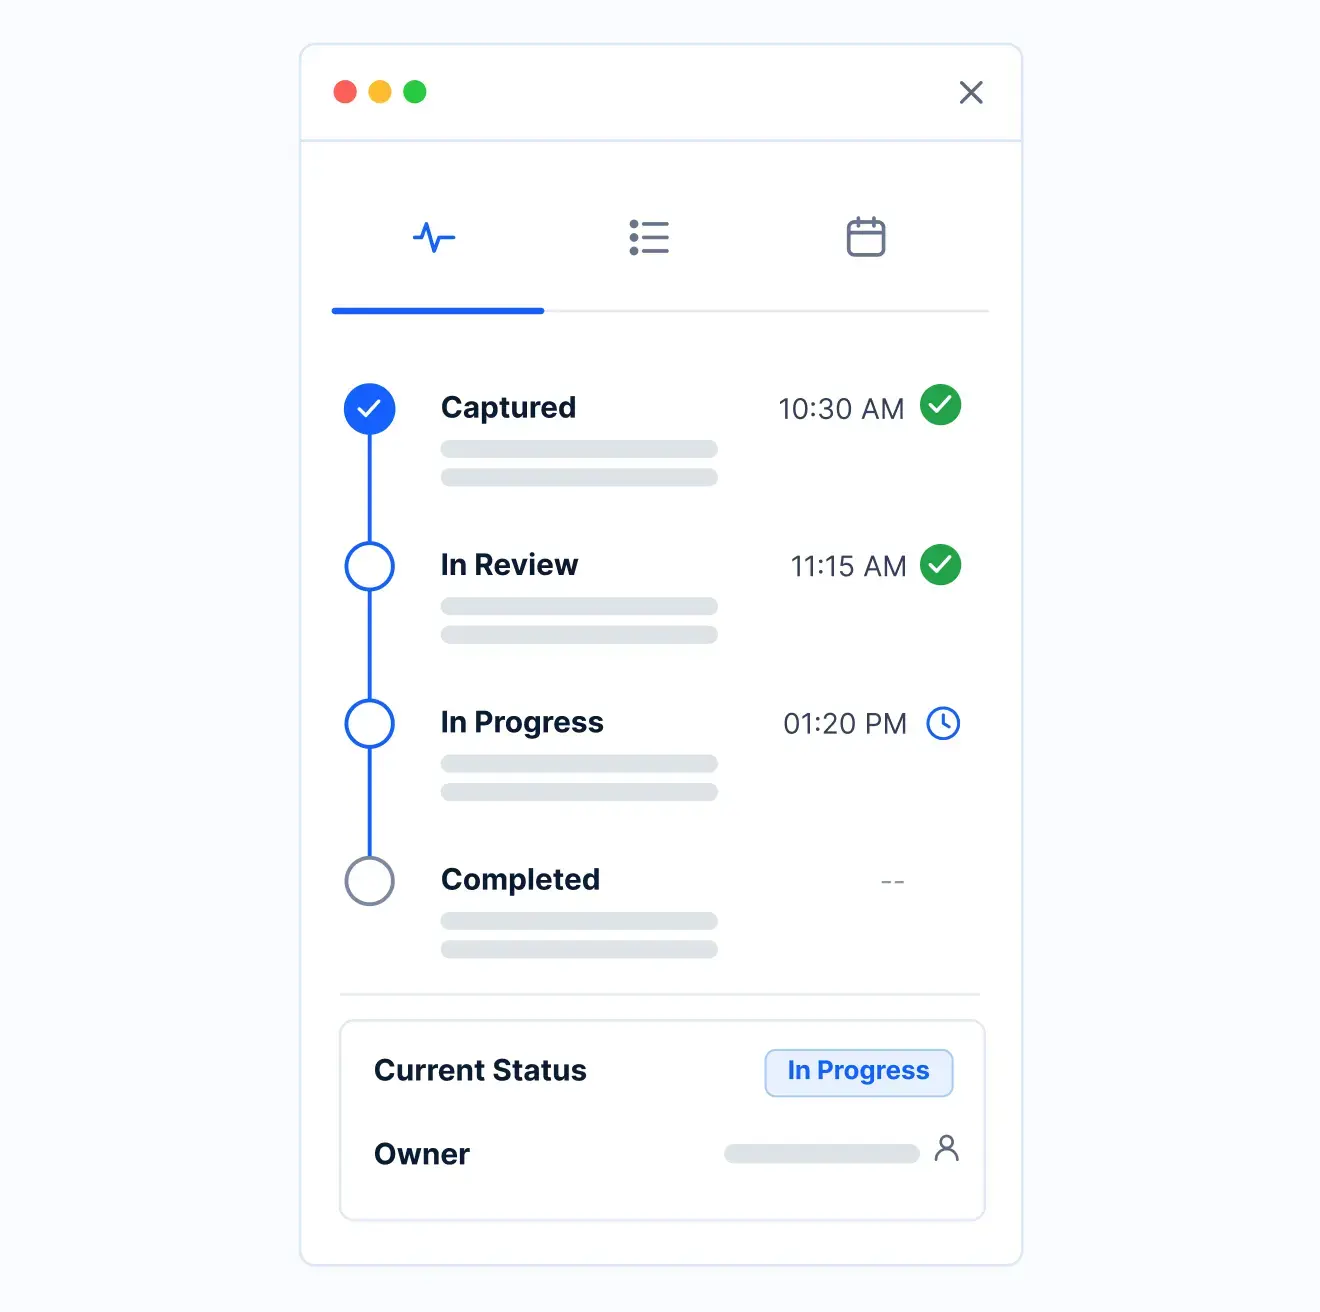
Stores are ranked against one another and outlier locations are flagged automatically.
Report
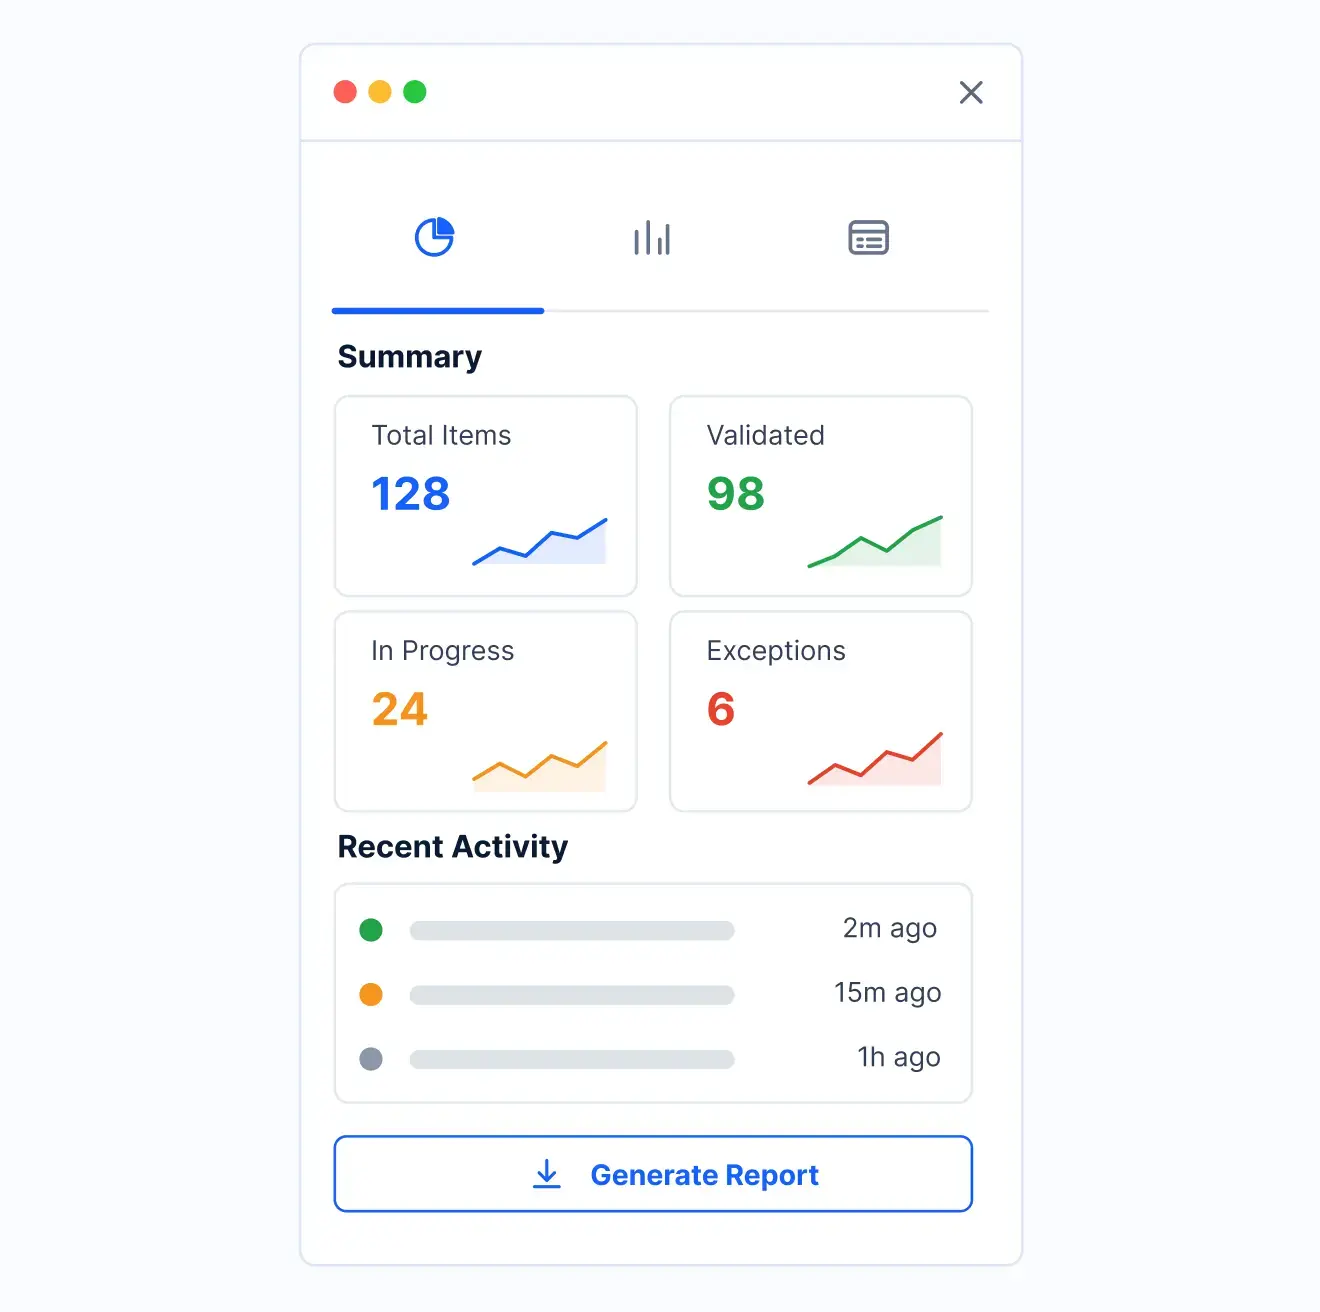
The dashboard is the system of record for maintenance performance, tracking the trend over time and supporting a regional performance review.
What changes when maintenance performance reporting runs on Kissflow
| Process | Before Kissflow | On Kissflow |
|---|---|---|
| Performance measurement | A chain-wide average | Calculated per store |
| Repeat failures | Untracked as a pattern | Flagged per store and per asset |
| Cost comparison | Not compared across stores | Ranked by store |
| Outlier detection | Hidden inside the average | Visible in the ranked view |
| Review timing | After a bigger issue emerges | Proactive, based on the dashboard |
| Data source | Manually compiled | Pulled directly from the maintenance suite |
Connects to the broader Kissflow maintenance suite; Kissflow does not replace your CMMS of record
Kissflow rolls up data already captured across the maintenance suite. Your CMMS or ERP stays the system of record for underlying cost and asset data.
.svg)



.svg)
.svg)
.svg)
.svg)

.svg)
.svg)
.svg)
.svg)
.svg)

.svg)

.svg)

.svg)
.svg)
.svg)
.svg)
.svg)
.svg)
.svg)
.svg)
.svg)

.svg)
Built for how a maintenance problem store actually needs to be found
Ranked, not averaged
A struggling store does not hide inside a chain-wide number.
Repeat failures flagged as a pattern
The same equipment failing again at one store is visible.
Data pulled from the suite, not compiled manually
The dashboard reflects real, current work order and dispatch data.
Live in weeks
Configure performance metrics in the visual builder, or describe the use case to the AI Builder.
Governed from day one
Role-based access on every performance record.
One view for facilities leadership
Every store's maintenance performance ranked in one place.
Related apps
We help facilities leadership find the one store hiding inside the average
.gif)

“If a company cannot enable everybody to use AI, they will never get the true benefit of AI. Platforms like Kissflow allow us to put that capability in the hands of our users in a safe way.”
Vagesh Dave
GVP & CIO at McDermott International, Ltd
See The Full Story

“Advanced automation of all processes is easy to set up. I cannot imagine how to manage workflows without this software.”
Tanay Tiwary
Global Head - Digitalization & Business Improvement
See the Full Story

“Kissflow supports rapid application development by building a working application prototype in the shortest amount of time.”
Maria Theresa Cabigon
CIO, SN Aboitiz Power Group
See The Full Story
See what Kissflow can do for you
Talk to usGot questions? We're here to help.
Get SupportNo. Your CMMS or ERP stays the system of record for underlying cost and asset data. Kissflow rolls up performance from data already captured across the maintenance suite.
Yes, MTTR, repeat-failure rate, and cost are calculated and ranked per store.
Yes, repeat failures on the same asset at a specific store are flagged.
It is pulled from the maintenance work order, dispatch, and vendor coordination apps in the same suite.
Yes, the dashboard is built to support a regional maintenance performance review.
Yes, cost is tracked and ranked per store alongside MTTR and repeat-failure rate.
Configuration and AI-assisted app generation move delivery from a multi-month program to a matter of weeks.
Kissflow is certified to SOC 1, SOC 2, SOC 3, and ISO/IEC 27001, with role-based access on every record.