Kissflow does two things really well
CIO/IT Leaders
If you have a huge backlog of internal applications
and processes to be built
Kissflow is the RIGHT platform
 To build custom applications
- Automate simple to complex processes
- Handle ticketing and support requests
30,000 Hours
Productivity Gained
260%
ROI Achieved
Trusted by

CDO/Transformation Leaders
If you are building a digital-first organization
leveraging citizen development
Kissflow is the ONLY platform that
- Users embrace AND IT celebrates
- Has the right blend of simplicity and power
- Uses Generative AI to reduce the semantic gap
- Delivers 10x productivity gains
222,720 Hours
Productivity Gained
$810,000
ROI Achieved
Trusted by
Kissflow does two things really well

CIO/IT Leaders
If you have a huge backlog of internal applications
and processes to be built
Kissflow is the RIGHT platform
- To build custom applications
- Automate simple to complex processes
- Handle ticketing and support requests
Trusted by


CDO/Transformation Leaders
If you are building a digital-first organization
leveraging citizen development
Kissflow is the ONLY platform that
- Users embrace AND IT celebrates
- Has the right blend of simplicity and power
- Uses Generative AI to reduce the semantic gap
- Delivers 10x productivity gains
222,720 Hours
Productivity Gained
$810,000
ROI Achieved
Trusted by

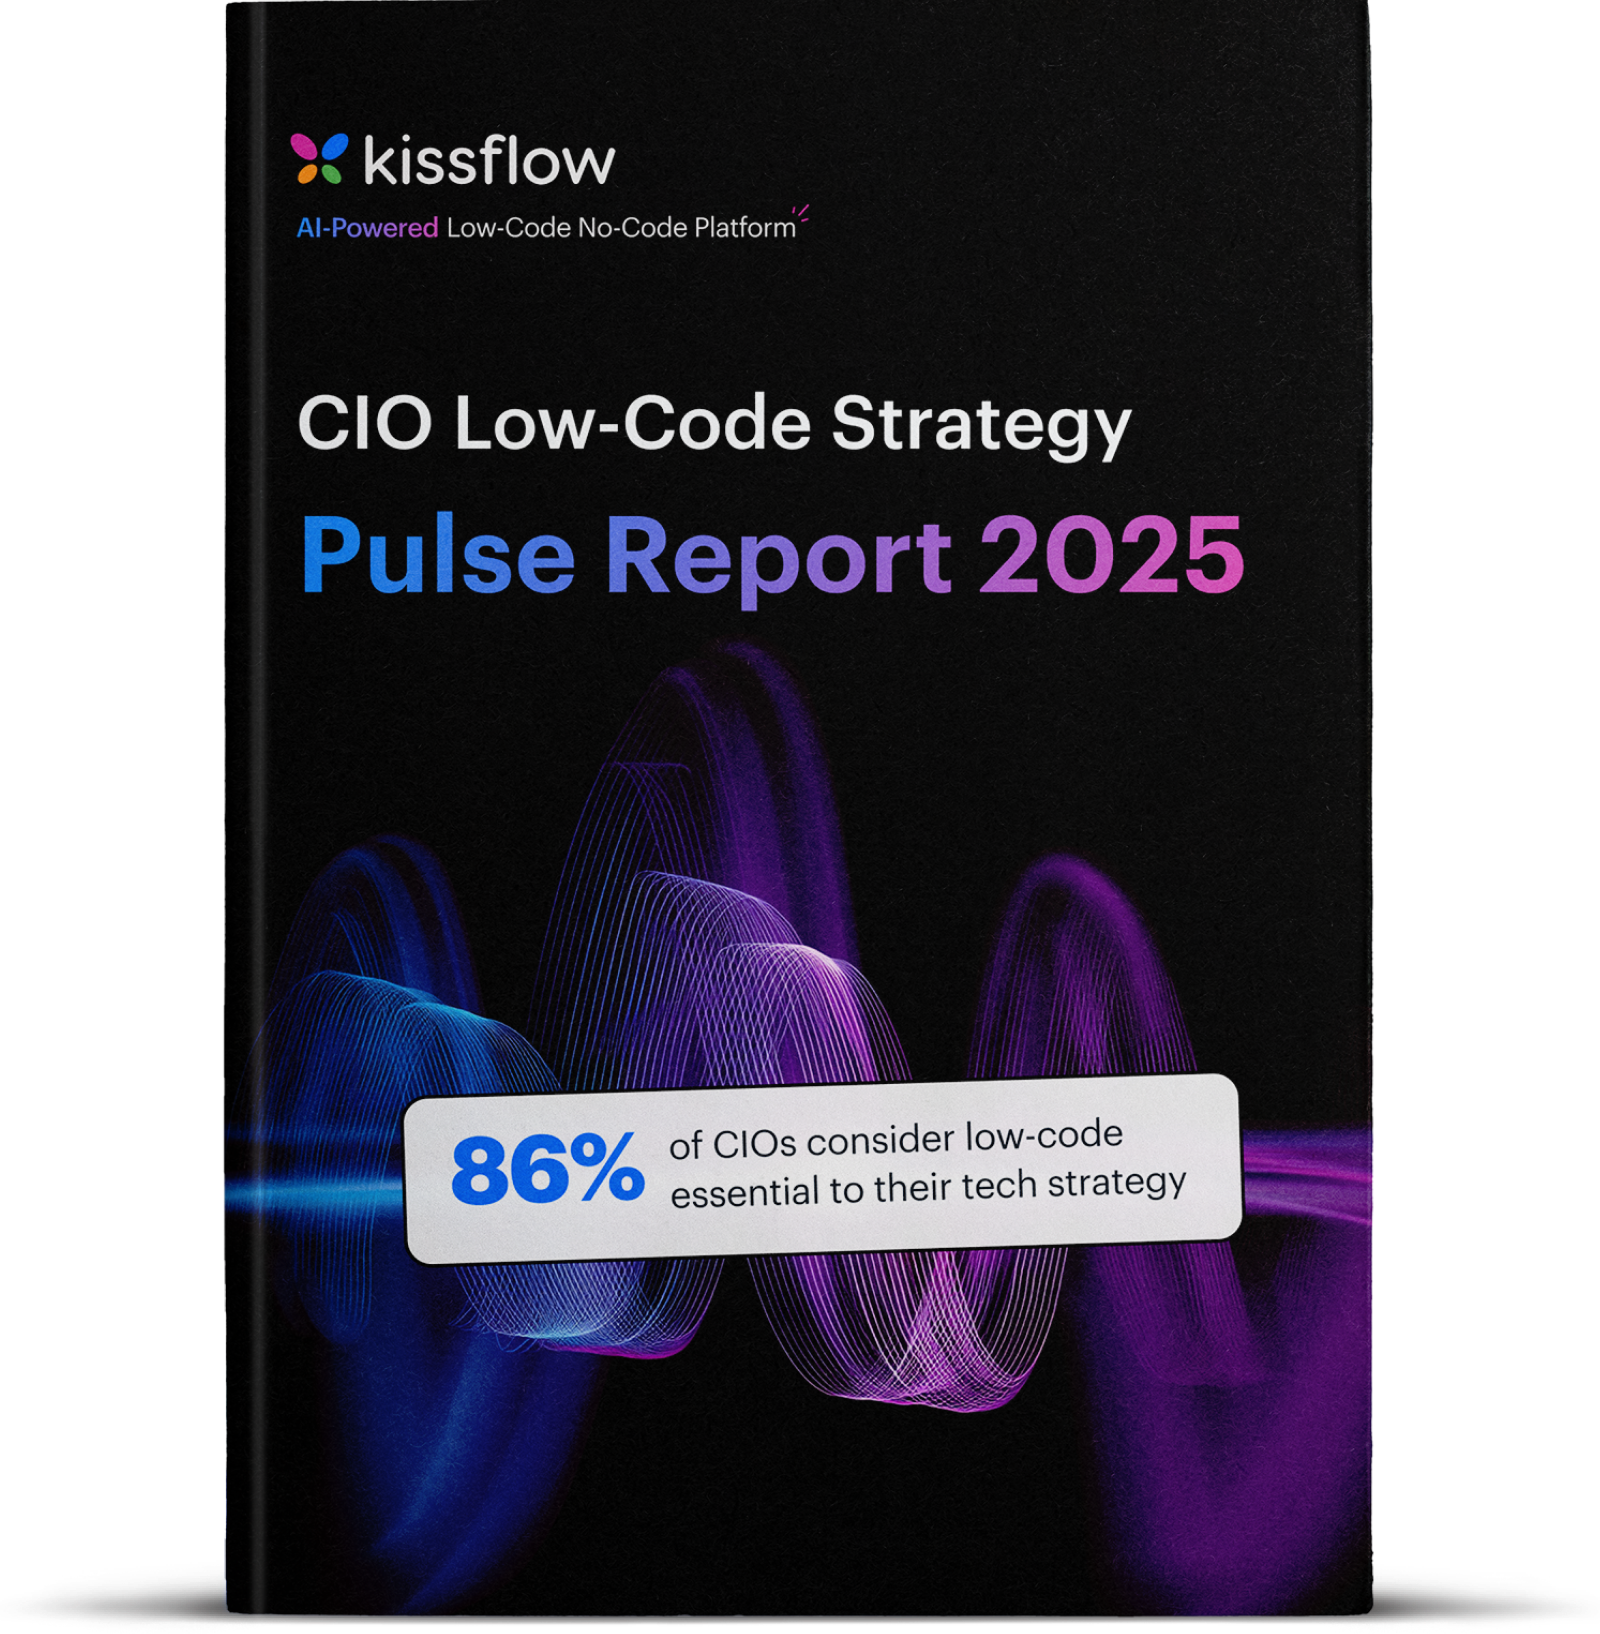
Don’t take our word for it

Market Leaders in the G2 Grid for 2024


Pricing starts at
$2,500 /month
Talk to our Solution Architect to see if Kissflow is the right platform for you
By signing up, I accept the Kissflow Terms of Service and Privacy Policy